
Hierarchies and drill down
Hierarchy
Hierarchies are structured data arrangements that allow users to analyze data at different levels of granularity, moving from broader categories to more specific details through interactive drill down and drill up actions.
Their main purpose is to allow the exploration of multi-level relationships in data visualizations.
You can place up to 5 columns in a hierarchy.
Creation
Hierarchies can be created using the button located in the footer of the list of dataset columns, as well as from the three-dot column menu.
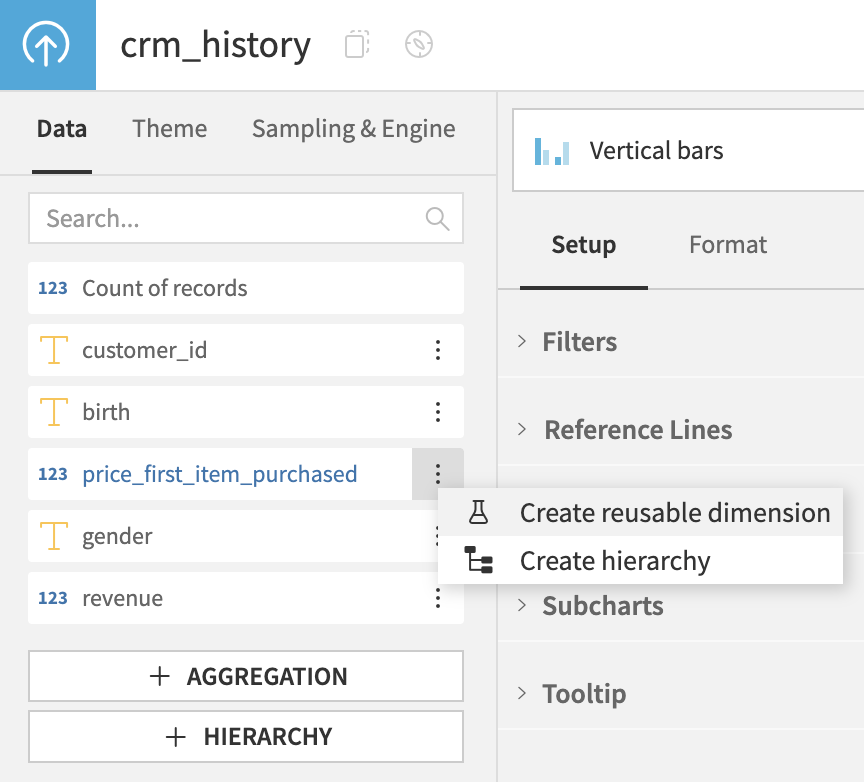
Upon clicking one of those buttons, a hierarchy creation modal is opened. The user is then prompted to input a unique name for the hierarchy, and add from 2 to 5 columns to create the structure.
Once a hierarchy is created, it is available under the list of dataset columns. It is defined at the dataset level, and therefore can be used for all the charts within this dataset.
Hierarchies can be edited, duplicated or removed. If a hierarchy used in a chart is edited, its level will be reset to the root.
Support
Hierarchies can be used in the following charts: vertical and horizontal bars (normal, stacked, and 100%), pie, donut, lines, mix, pivot table, treemap, radar, grouped XY, binned bubbles and rectangles, stacked areas (normal and 100%), boxplot, and lift.
Drilling down and up in a hierarchy
The navigation between hierarchy levels is done by performing drill-down and drill-up actions.
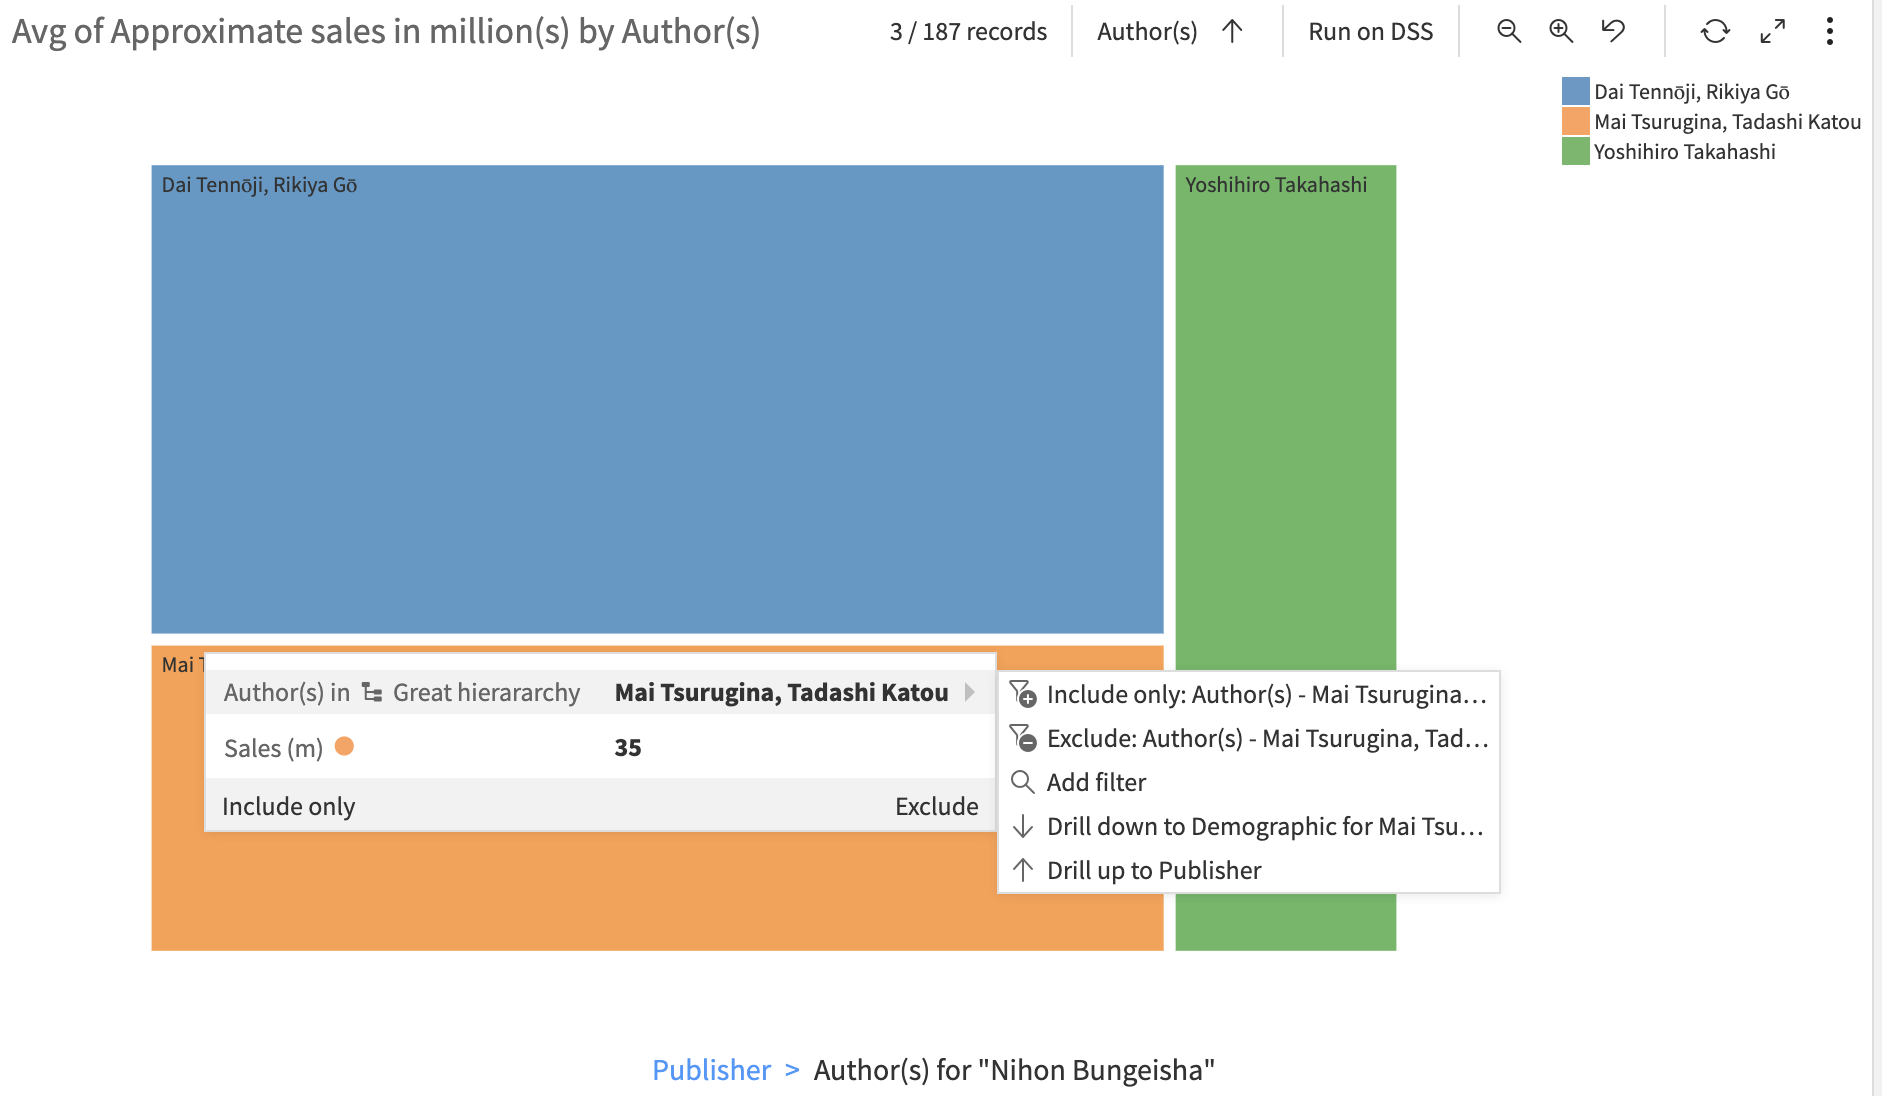
A drill down represents a move from a general, high-level overview of data, to more specific, detailed levels within the same dataset. When a drill down action is performed, the current dimension in chart is replaced by the next-in-line dimension in the hierarchy, and a filter is added on the selected dimension value. The newly created filter is not editable. This action can be performed from the chart tooltip, and the contextual menu.
A drill up action is the opposite of the drill down action. When it is performed, the filter corresponding to the current dimension is removed, and the current dimension is replaced by the previous dimension in the hierarchy. This action can be performed from the chart tooltip, contextual menu, breadcrumb and chart header.
Hierarchy level can be changed without performing a drill action as well, when modifying dimension settings from the hierarchy drop down menu or the “Data labels” section in the formatting pane.
Drilling on dashboards
When a chart that uses hierarchies is published to a dashboard, the drill down and up actions can be performed in the dashboard’s view mode. The drill down action, when done in a dashboard context, creates a dashboard-level filter that affects all the other tiles present in this dashboard. The drill up action removes this filter.
Visual indicators
Breadcrumb
The term “Breadcrumb” refers to the hierarchy state indicator displayed under the chart using a hierarchy. It represents a path from the hierarchy root to the current chart state, including the values selected for each dimension. It can be deactivated in the formatting pane on the left side of the chart. The breadcrumb, even if deactivated, is displayed when hovering the hierarchy dimension name in the chart header. The breadcrumb is only visible when the chart is already in the drilled-down state. It can be used to perform a drill up action upon clicking on one of its elements.
Note
The breadcrumb is not available in the pivot table.
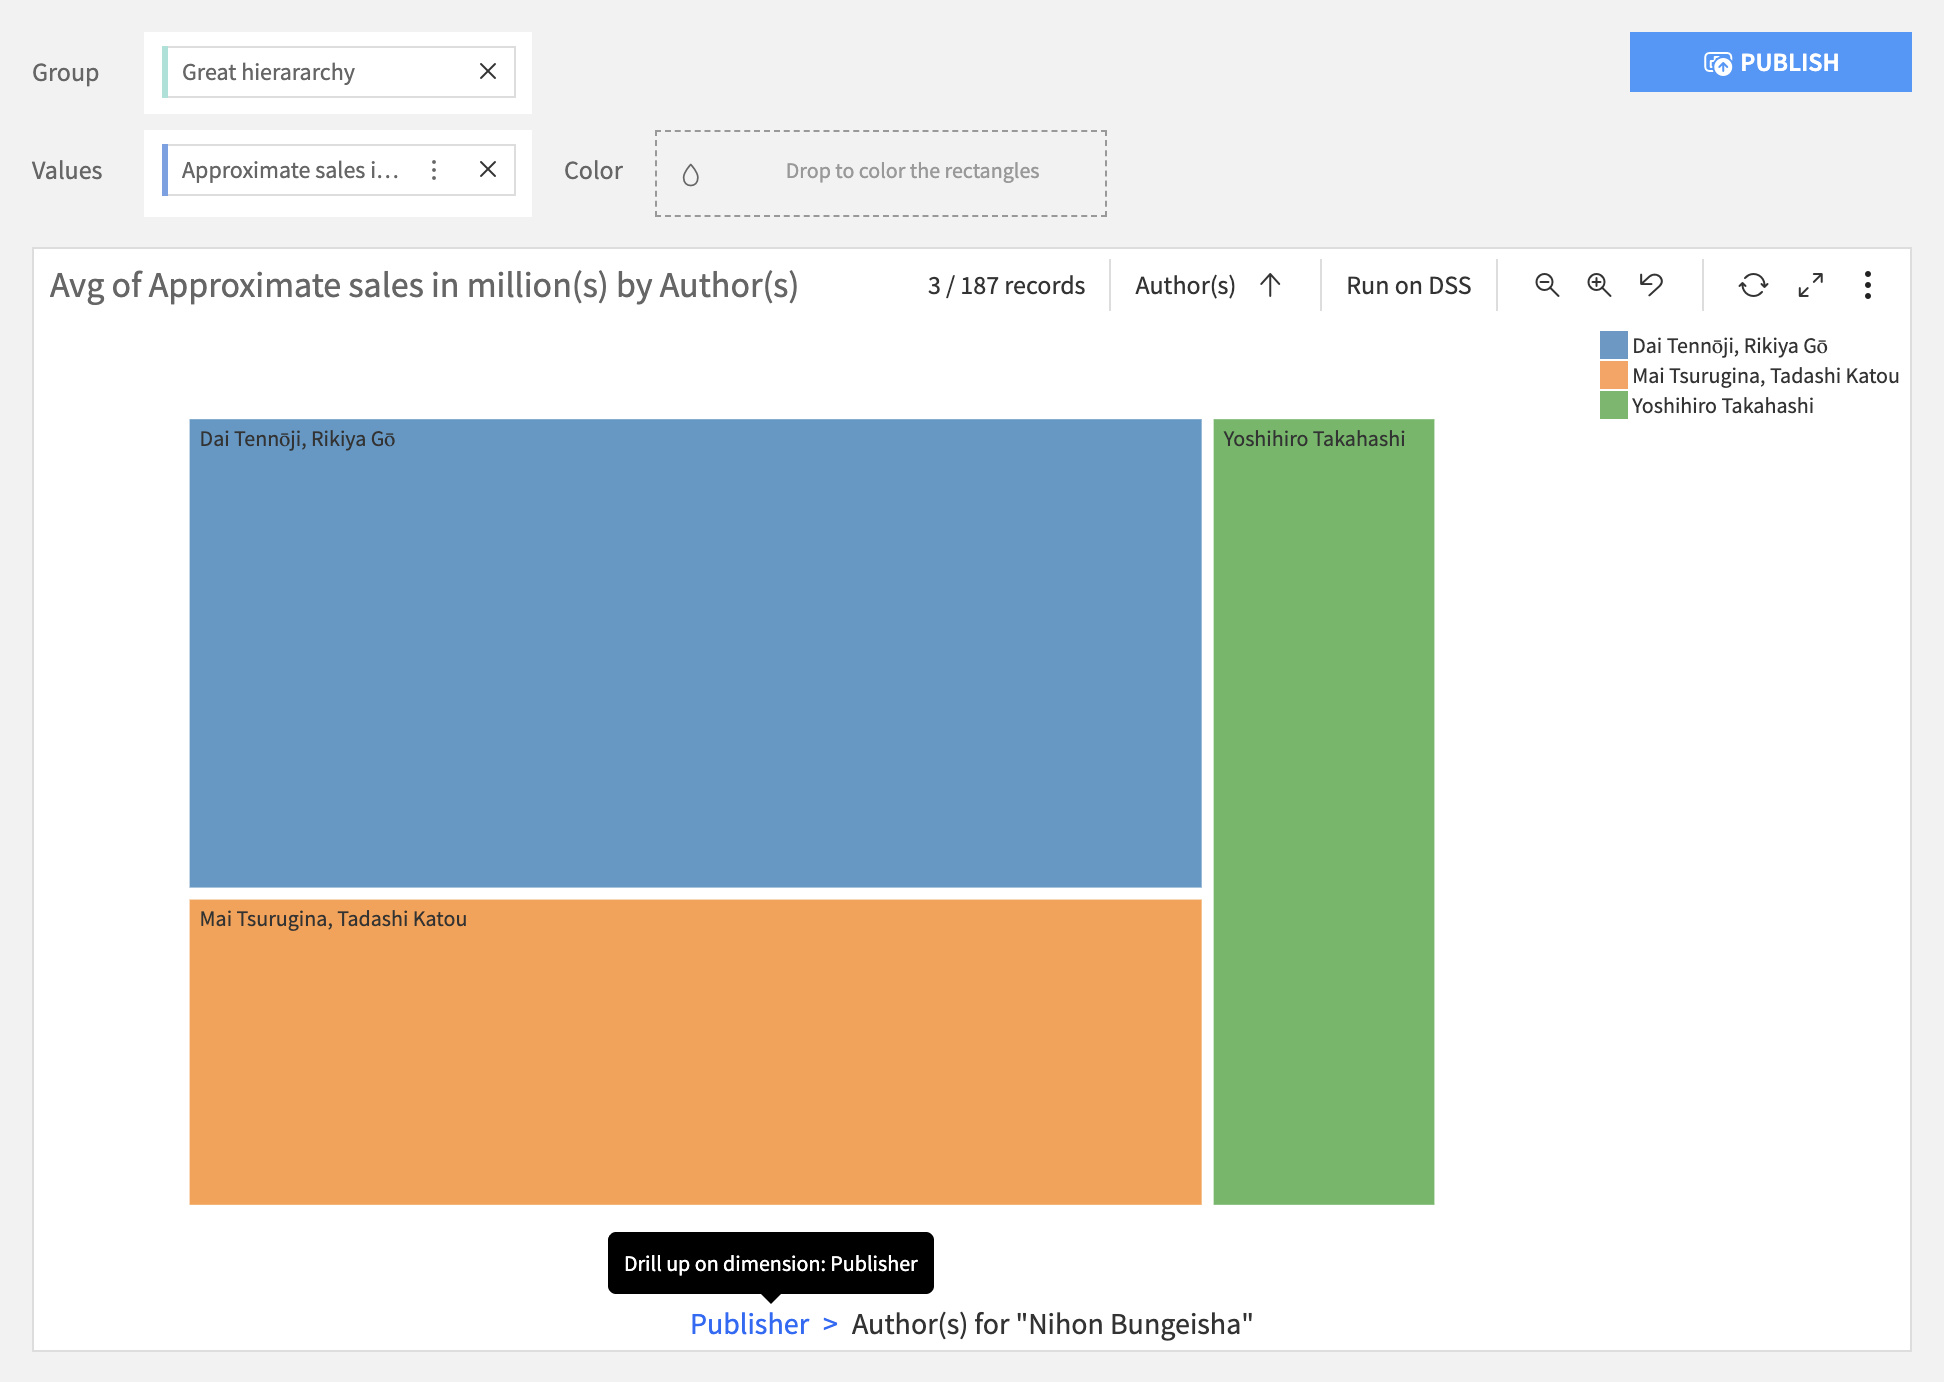
Chart header
When a hierarchy is used in chart, its current dimension is displayed in the chart header, followed by a drill up action button (disabled when hierarchy is at root level).