Reference lines
Reference lines in data visualization are horizontal or vertical lines that are used to provide a visual reference point for comparison or context within a chart or graph. They help users interpret data by indicating thresholds, or important values, enhancing the overall understanding and analysis of the visualized information.
This feature is available on the following charts:
Vertical bars
Vertical stacked bars
Vertical stacked bars 100%
Horizontal stacked bars
Horizontal stacked bars 100%
Lines
Mix
Scatterplot
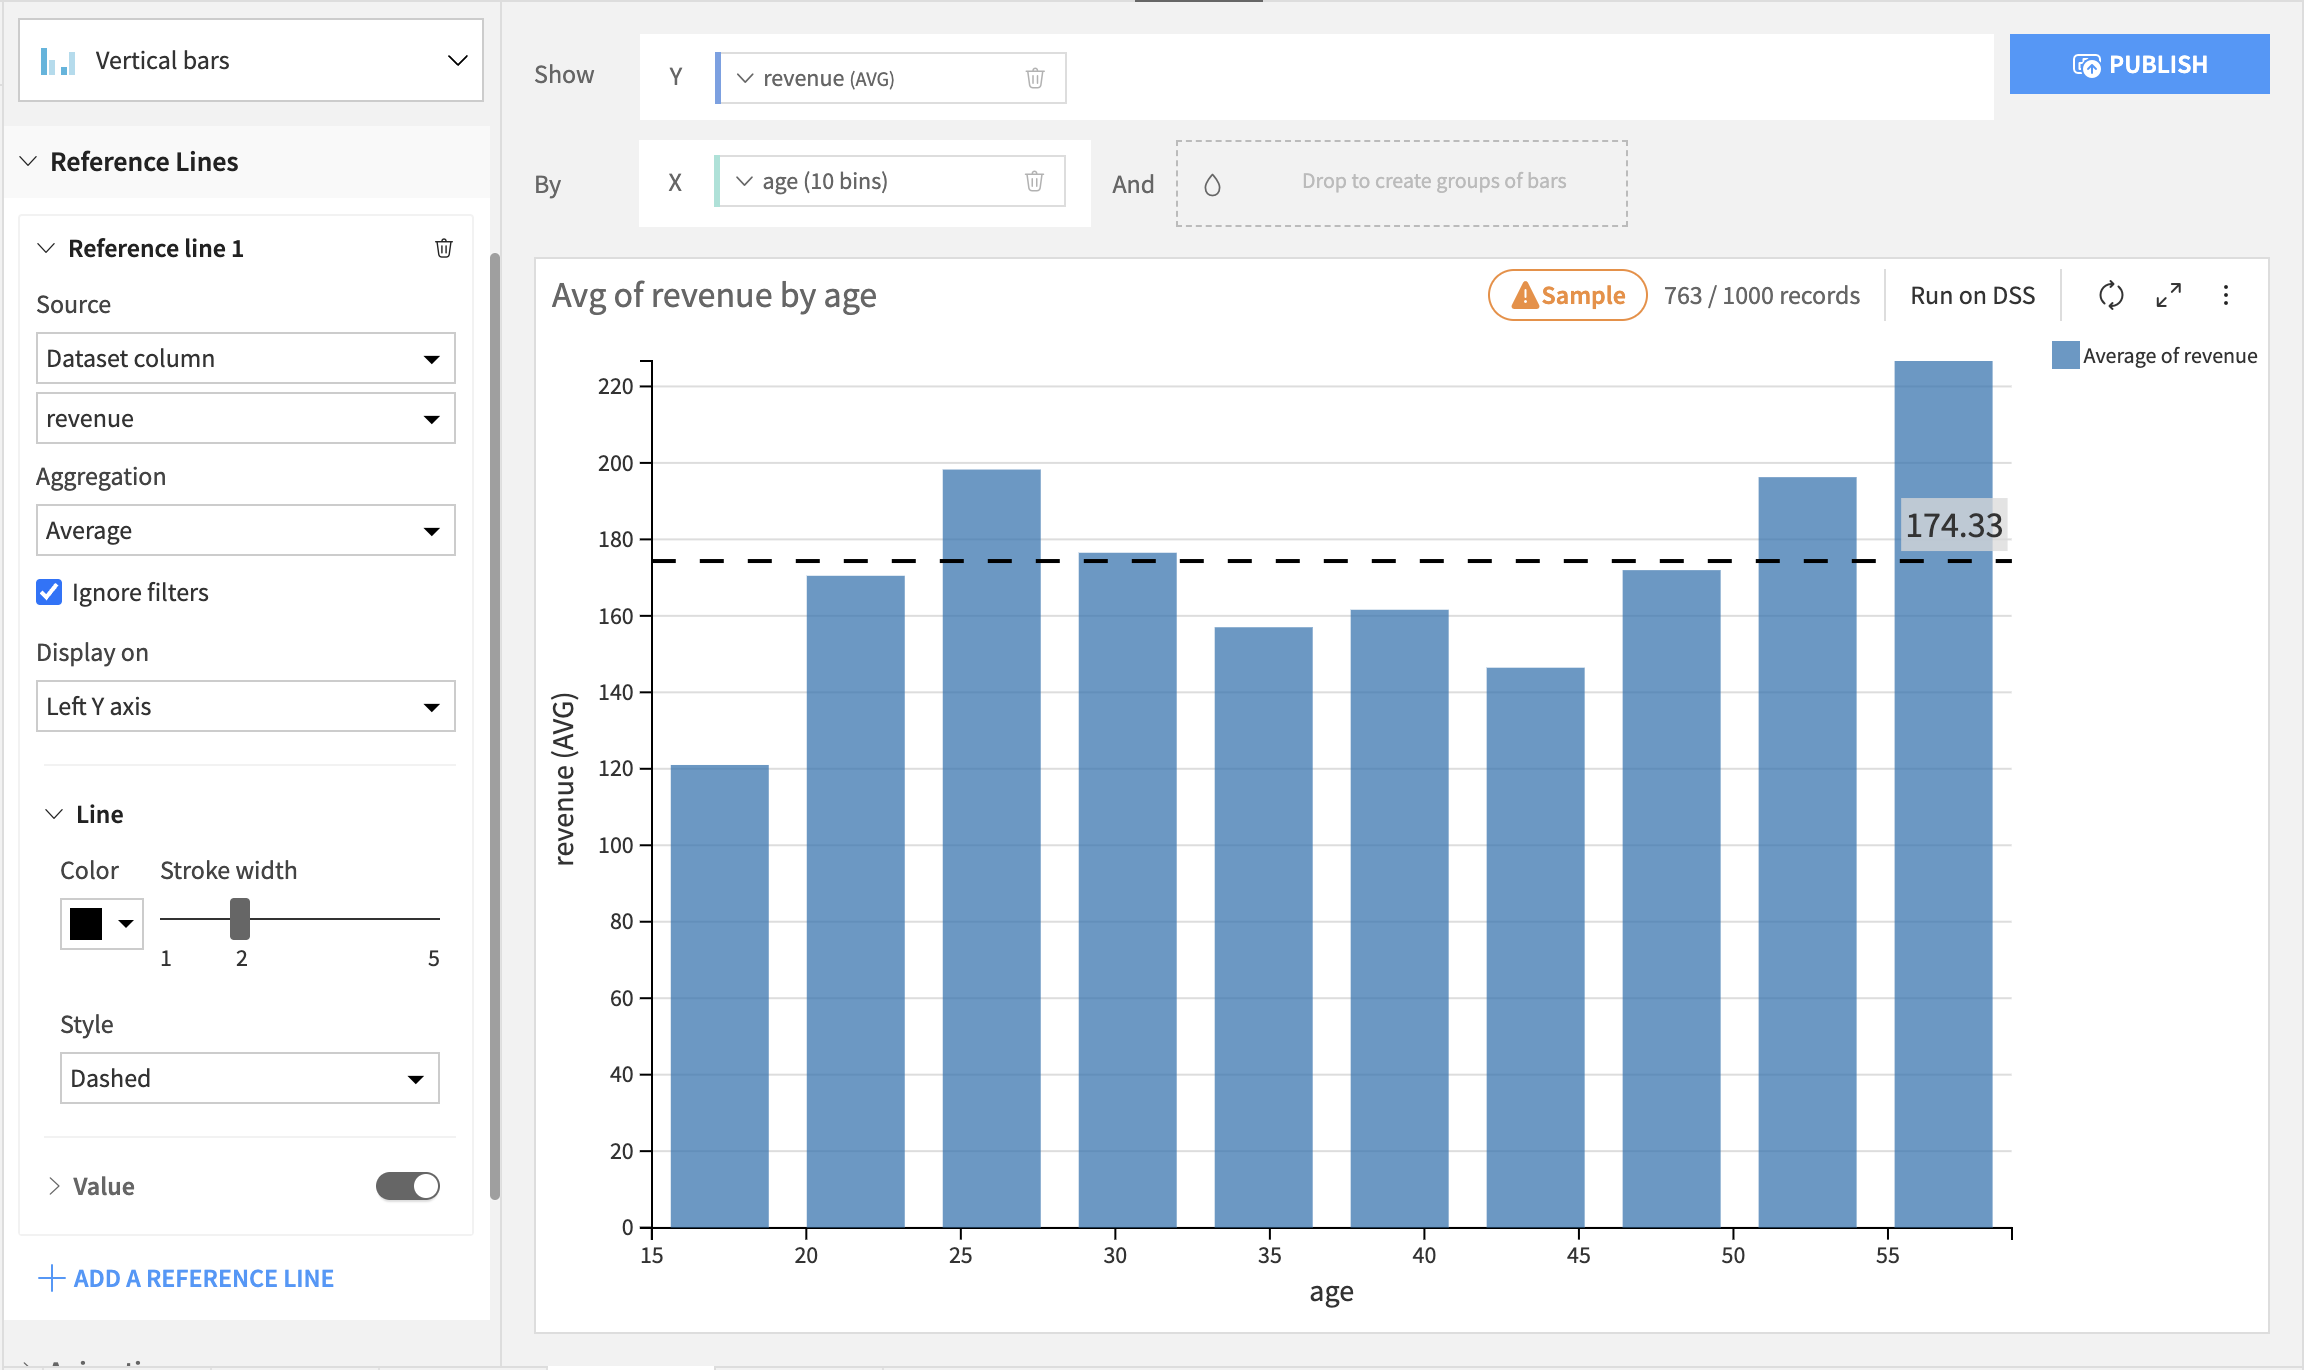
They can be added and customised in the “Reference lines” section on the left side of the chart. Each chart can have multiple reference lines.
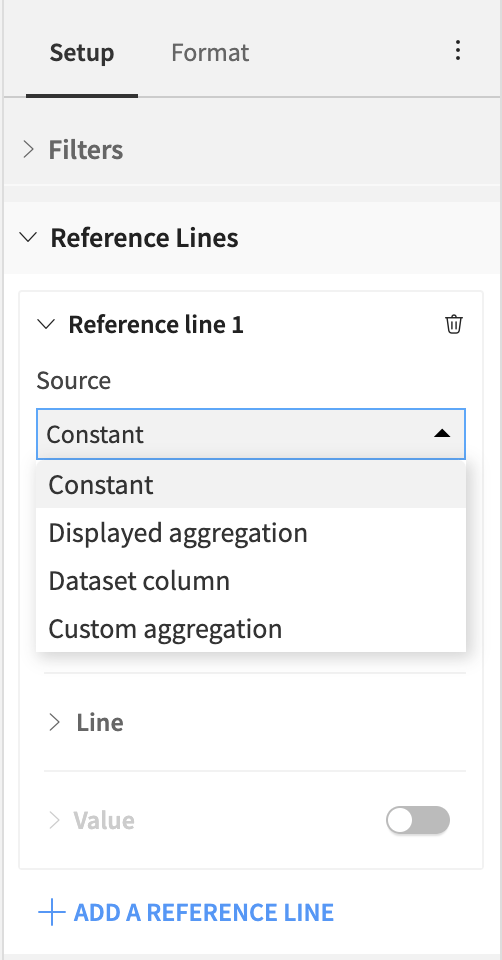
There are 4 source choices for defining reference lines:
Constant Value: To assign a static value as the reference line.
Displayed Aggregation: To aggregate values displayed in the chart (not the underlying columns). Note: this choice is not available for scatterplots as they are inherently unaggregated.
Dataset Column: To choose from all dataset columns and apply an aggregation to it.
Custom Aggregation: To choose from all created Custom aggregations.
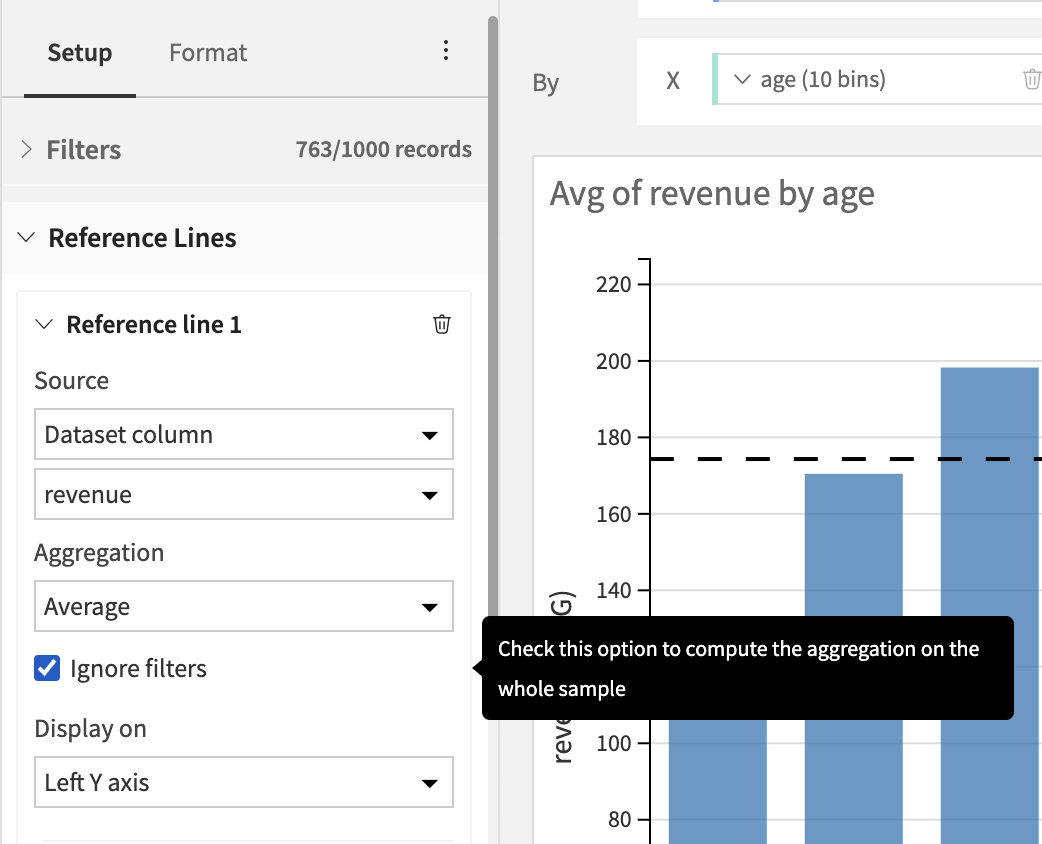
Additionally, when filters are applied to the chart, you have the option to choose whether to ignore filters for reference lines with sources Custom Aggregation or Dataset Columns. This functionality provides greater control over how reference lines interact with applied filters.
Note: If the value of your reference lines exceeds the chart’s axis range, it will automatically be updated in order for the line to remain visible.
The reference lines are customisable. You can define the line’s color, stroke width, style - dashed or filled, and for charts that can have more than one y axis you have to specify which axis should the line appear on. If you decide to display the value of the reference line, you can select a prefix, a suffix, a position of the value, a multiplier and customize the font size, color, and the background of the value.