
The Charts Interface
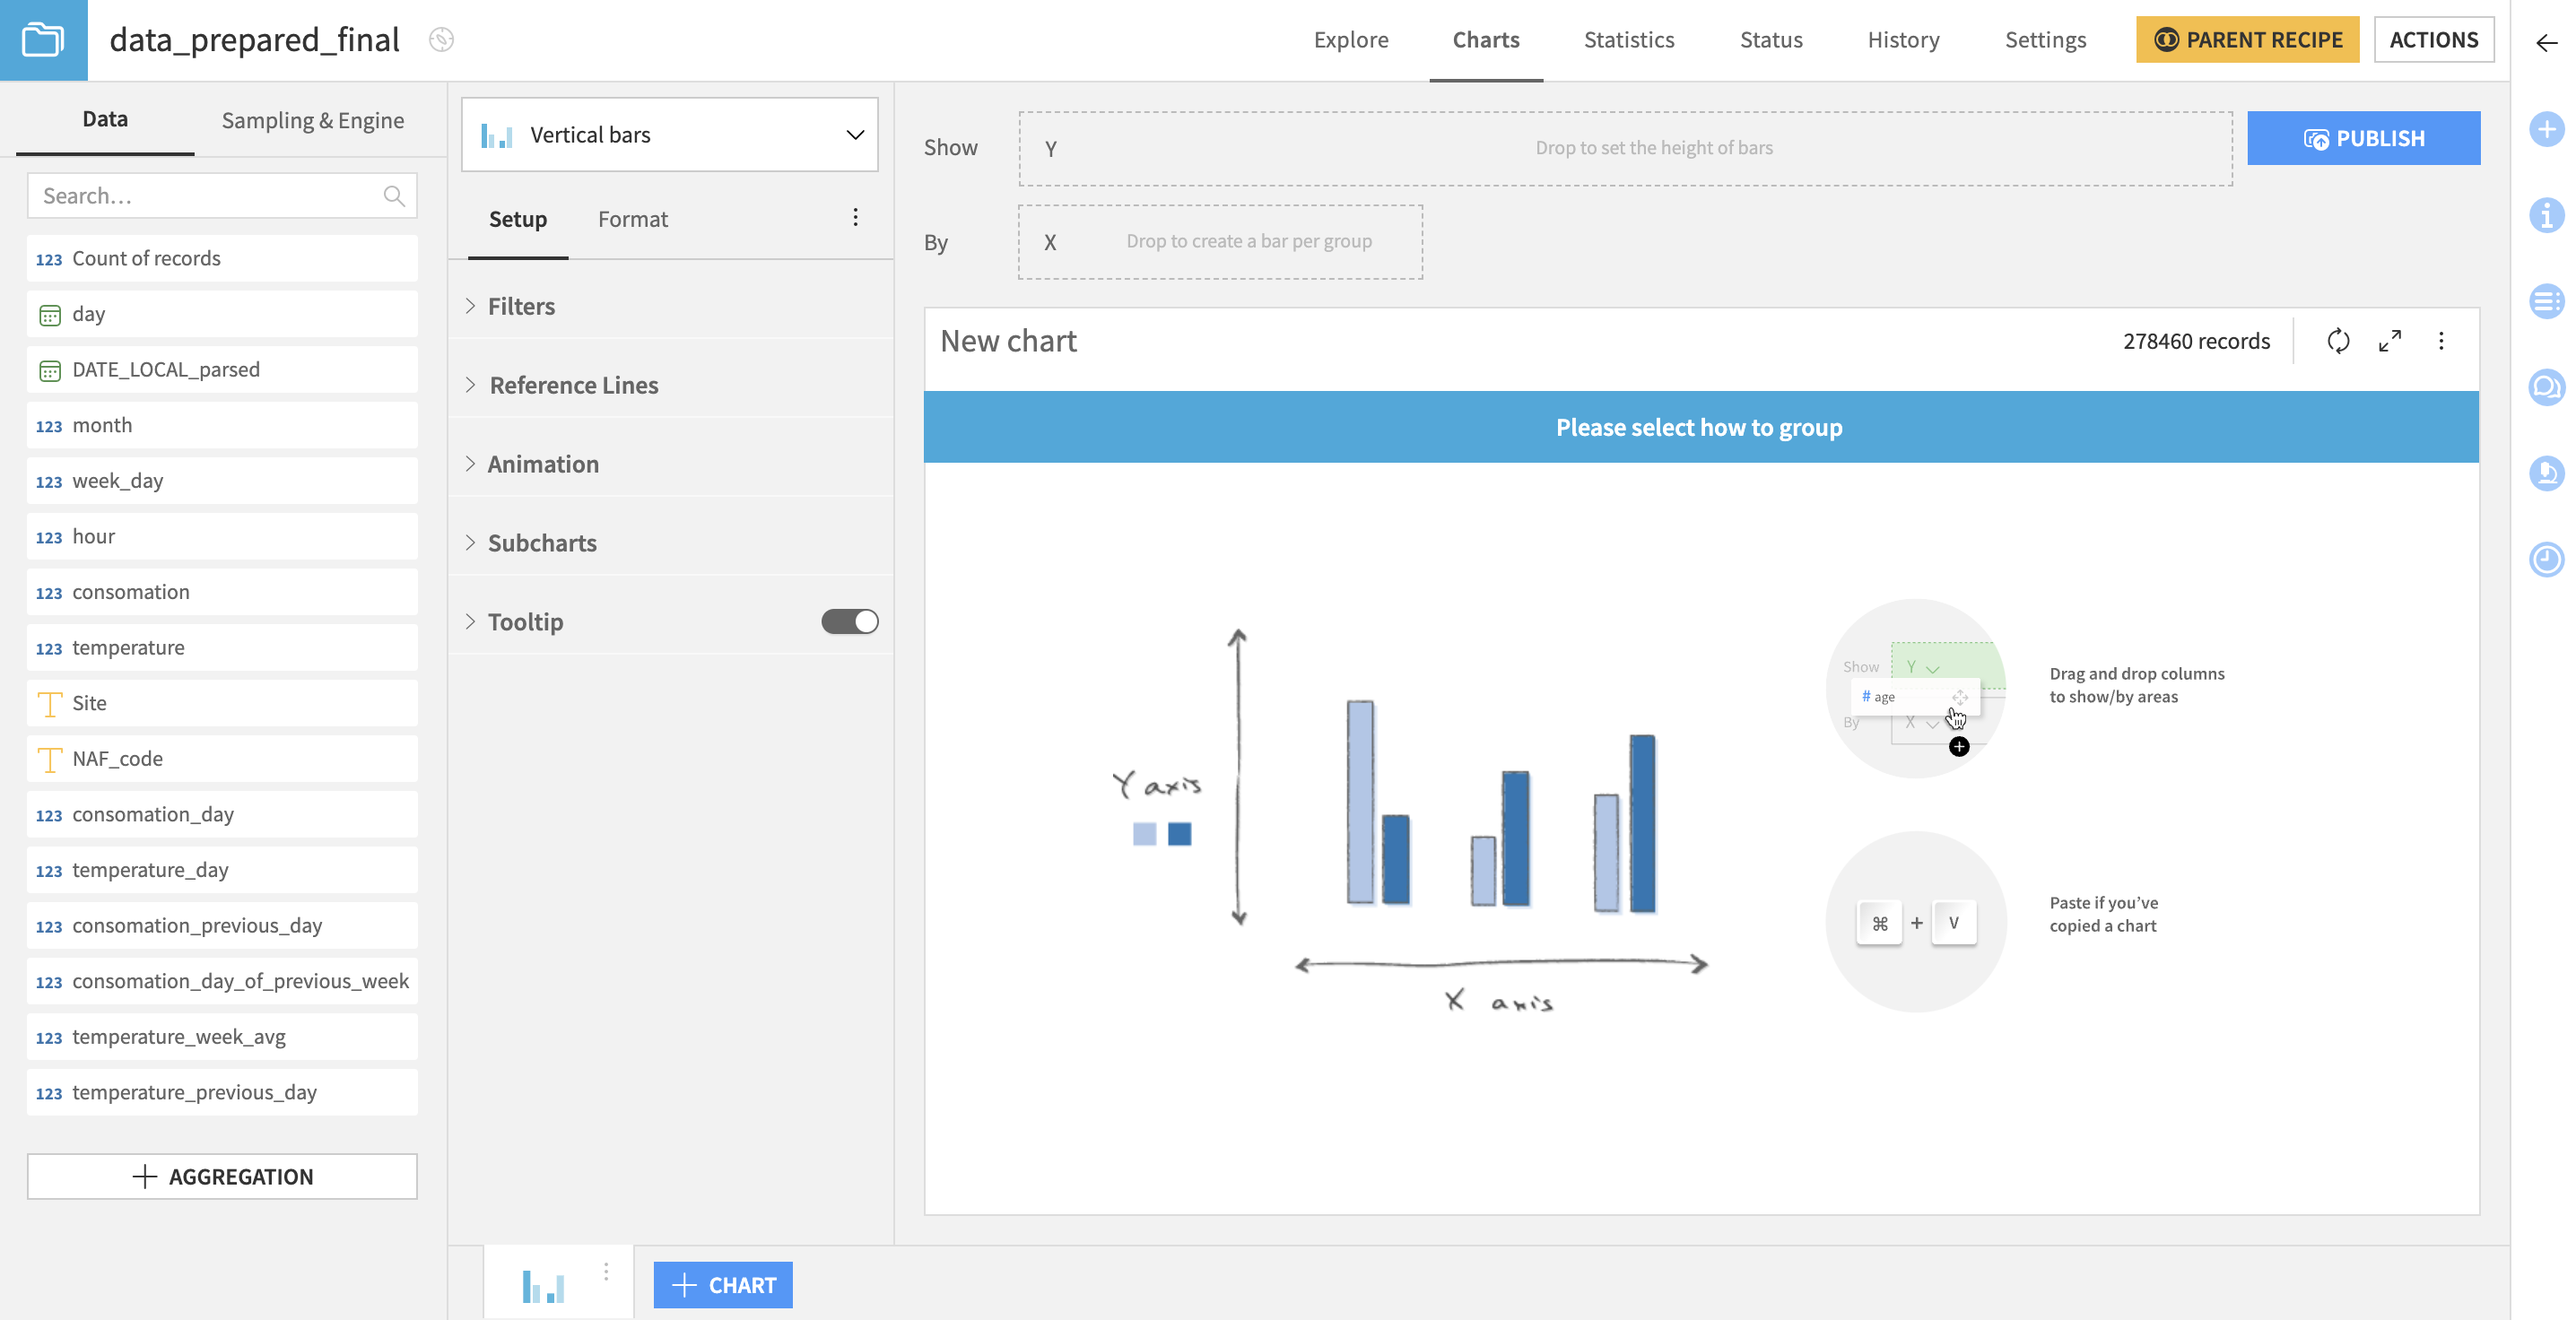
The Charts interface has the following components:
The Columns, Sampling & Engine panel is a control with two tabs.
The Columns tab provides a searchable list of columns in the dataset that you can use to build charts. A special Count of records column is always available.
The Sampling & Engine tab allows you to set how the dataset is processed.
The Chart type selector determines the form of the chart. Choose from the Basics, Tables, Scatters, Maps, or Other chart types.
- Chart definition elements define the contents of the chart. The exact set of required elements varies by chart type. Drag and drop columns from the Columns panel to the appropriate controls here.
Measures and dimensions settings can be found in this area. To access them, click the carret before the measure/dimension name. From this carret you’ll be able to configure the element and access its formatting options.
The Publish button creates an Insight from the Chart and publishes it to a Dashboard
The Common chart elements refine the display of the chart. The Setup tab defines the data used in the chart and how the chart will be build; and the Format tab allows to customize and refine it. See Common Chart Elements for details.
The Chart display displays the currently defined chart. You can edit the title of the chart by clicking on the pencil icon.
The Chart tabs along the bottom of the display allow you to navigate between multiple charts created for the dataset. You can duplicate or delete individual charts, or click +Chart to create a new chart from scratch.