
Interactive decision tree builder
This plugin provides a webapp and recipe to manually create decision trees and use them to score and evaluate datasets.
Description
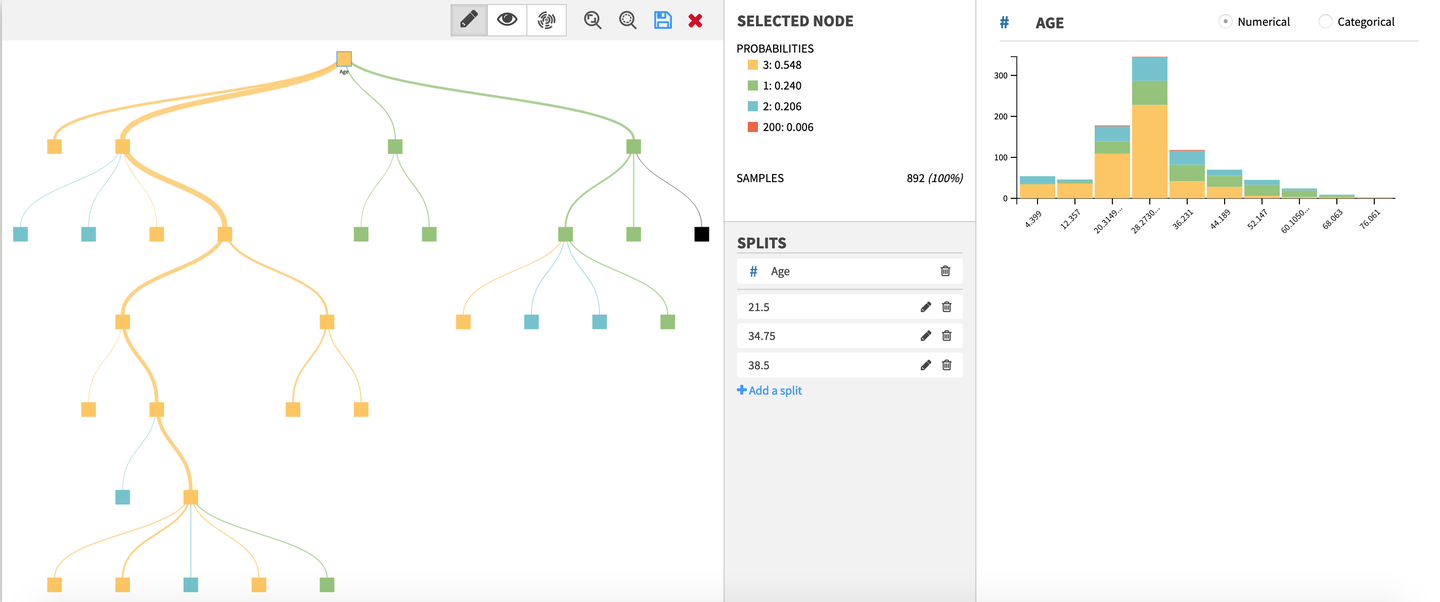
This plugin offers one visual webapp to build a decision tree step by step, and two visual recipes to score and evaluate datasets using a decision tree made with the aforementioned webapp.
Build and save a decision tree (Webapp)
Score a dataset using a saved decision tree made with the webapp (Recipe)
Evaluate a dataset using a saved decision tree made with the webapp (Recipe)
This plugin can be used for binary or multiclass classification, but does NOT yet support regression.
The webapp can be used for exploratory analysis, to come up with new ideas for feature engineering or to better understand the content of unfamiliar datasets.
Specific business rules can be implemented, and effectively compared with results from Machine Learning algorithms thanks to the two recipes.
The webapp can also be used to interactively bin data.
Installation Notes
Install the plugin from the Plugin Store or from a ZIP file as described in Installing plugins.
How to use
Interactive Decision Tree Builder webapp
Settings
Use this webapp to create and visualize decision trees.
Folder (required): Select a managed folder to save and load trees. The webapp will not start until a folder is selected.
Getting started
From the landing page of the webapp, one can either create a new tree or load a previously saved one.
Create or load a tree
Create a new tree: Requires to select a dataset and a target. Datasets exposed from other projects cannot be used.
Load an existing one: Requires to select the file where the tree was saved. The file must be saved within the folder used in the settings of the webapp.
Sampling parameters
Method: The sampling method used on the dataset:
Head: the first N rows.
Random: random sample of approximately N rows.
Full: all the rows (this is not recommended for bigger datasets).
Sample size: The number N of rows for the sampling method (Head or Random methods).
Building a decision tree
The webapp has three modes: one to edit the tree, and two to visualize it (as a tree or as a sunburst).
Save a tree:
Click Save as… in the toolbar and enter a filename. The webapp adds the .json extension automatically and saves the tree in the folder selected in the webapp settings. Use this file to load the tree later or select it in the Score and Evaluate recipes.
Edit mode:
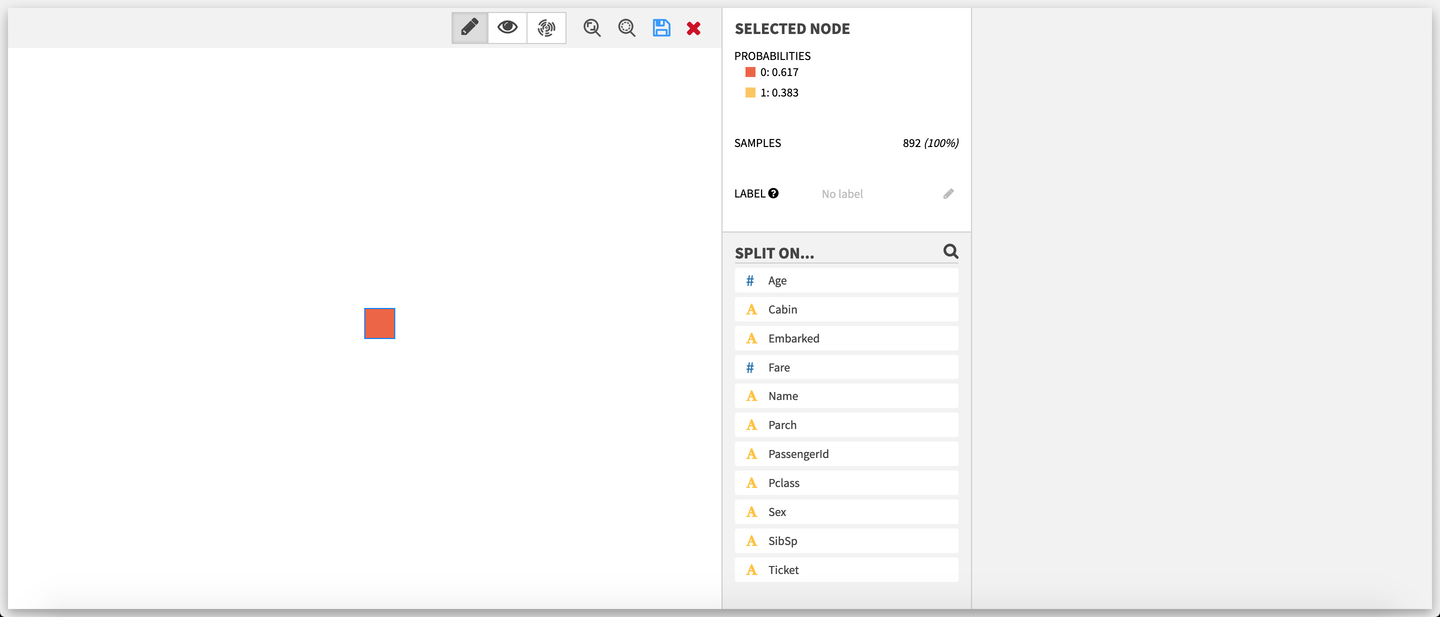
The decision tree builder opens in edit mode, with the root node selected. The edit mode allows the user to progressively build a tree from the root by creating splits.
Select a node:
After a node is selected, the Node section displays its ID and updates with various information:
The probabilities of the different target classes, in decreasing order. The first class in this list is the prediction for the node.
The number of samples.
The decision rule (Not displayed for the root node) .
The label (Optional - Only if the selected node is a leaf, ie. has no children nodes) . It is the only field that is editable. Once created, the label of a node is displayed below it. Labels are added as additional information to your samples in the score and evaluate recipes. They can be used for tagging, grouping different predictions or replace/provide more information on the prediction value for example.
Available actions if the selected node is a leaf:
If the selected node is a leaf, the list of features is displayed below the Node section. Use the search field above the list to filter features.
Add a split: Clicking on one of the features opens the split editor, to create a split manually or via auto creation.
Available actions if the selected node already has splits: If the selected node is not a leaf, the feature used for the splits on the node and the list of these splits are displayed below the Node section.
Add a split: Clicking on Add a split below the split list opens the split editor. Auto creation of splits will not be available.
Edit a split: Clicking on the pencil of a split opens the split editor.
Delete a split: Clicking on the bin of a split deletes it.
Delete all splits on a node: Only available if the node as two or more splits. Clicking on the bin next to the name of the feature chosen for the splits will delete all the splits at once.
Creating splits:
A split can be seen as a rule to separate the data between nodes, according to the value of one of the features of the dataset. In the decision tree builder, the features are treated as either categorical or numerical. As such, two types of splits are possible (categorical and numerical). To create N nodes, one has to create N-1 split.
For instance:
Categorical: splitting on Cat for the feature Animal will create two nodes (Animal is Cat and Animal is not Cat); splitting on Cat and on Dog will create three nodes (Animal is Cat, Animal is Dog and Animal is neither Cat nor Dog).
Numerical: splitting on 5 for the feature Age will create two nodes (Age < 5 and 5 ≤ Age); splitting on 5 and 10 for the feature Age will create three nodes (Age < 5, 5 ≤ Age < 10 and 10 ≤ Age).
Note that for numerical features, missing values are replaced with the mean. The split editor varies depending of the type of the feature on which the split is being created or edited.
Split editor on a categorical feature
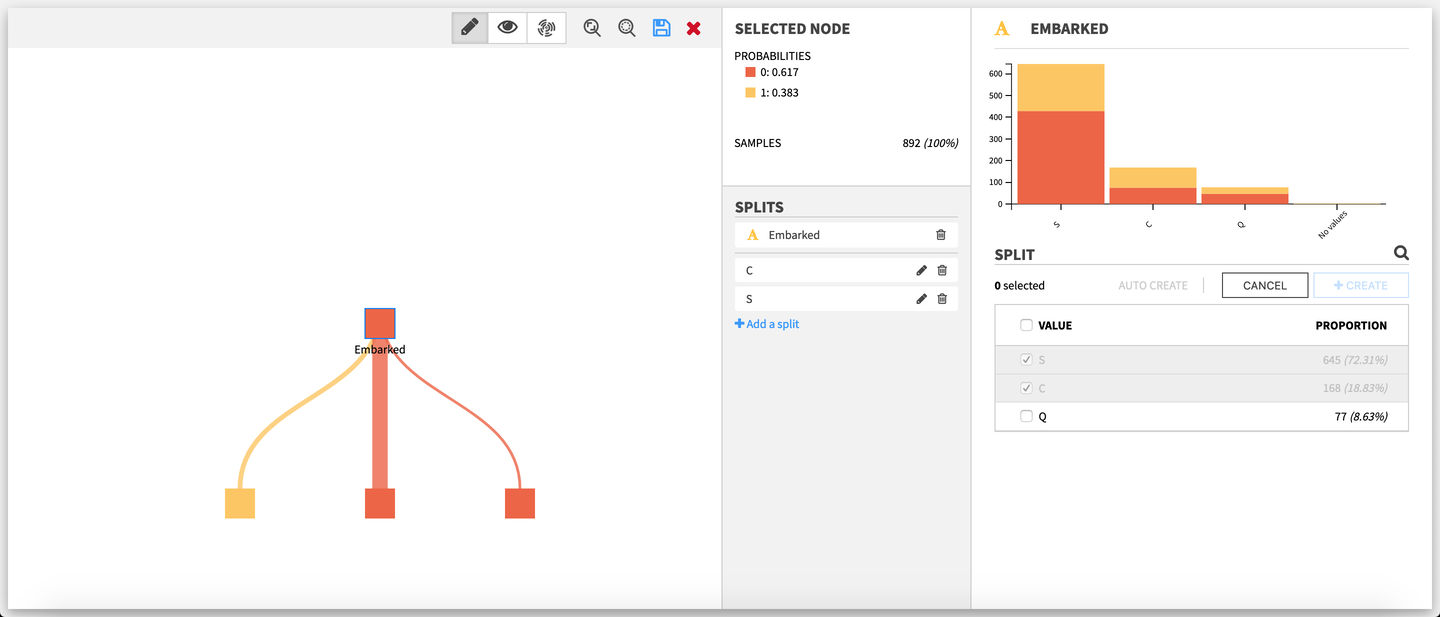
The upper part is a stacked histogram of the target distribution across the values of the feature. Only the ten bins with the most samples are represented, in decreasing order.
The lower part is the editor itself. To create or edit a split, one has to select one or more values in the list of the values taken by the feature. Use the search field above the list to filter values.
A split cannot take a value that already has been selected by another split on the same node; the value must first be unselected from this other split.
Split editor on a numerical feature
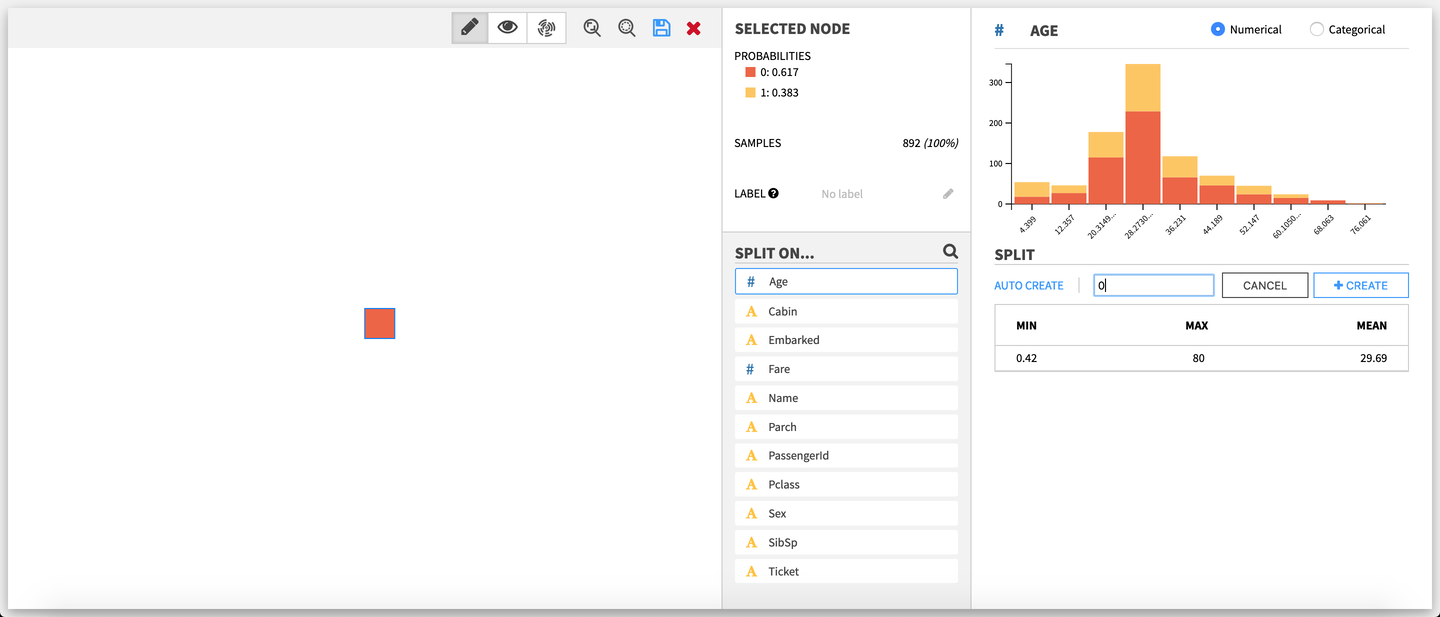
If the selected node is a leaf, there is one extra action available in the split editor of a numerical feature: switching between types (ie. the way the plugin treats the feature: categorical or numerical).
The upper part is a stacked histogram of the target distribution across the values of the feature. The data is divided between up to ten bins. The lower part is the editor itself. To create or edit a split, one has to enter a numerical value.
Auto-creation of splits
For both categorical and numerical splits, the user can choose to let the webapp backend compute automatically splits, by clicking on Auto create, and then entering the number of maximum desired splits.
Auto creation is not available when:
the node already has splits.
the target takes one value or less in the sample of the selected node.
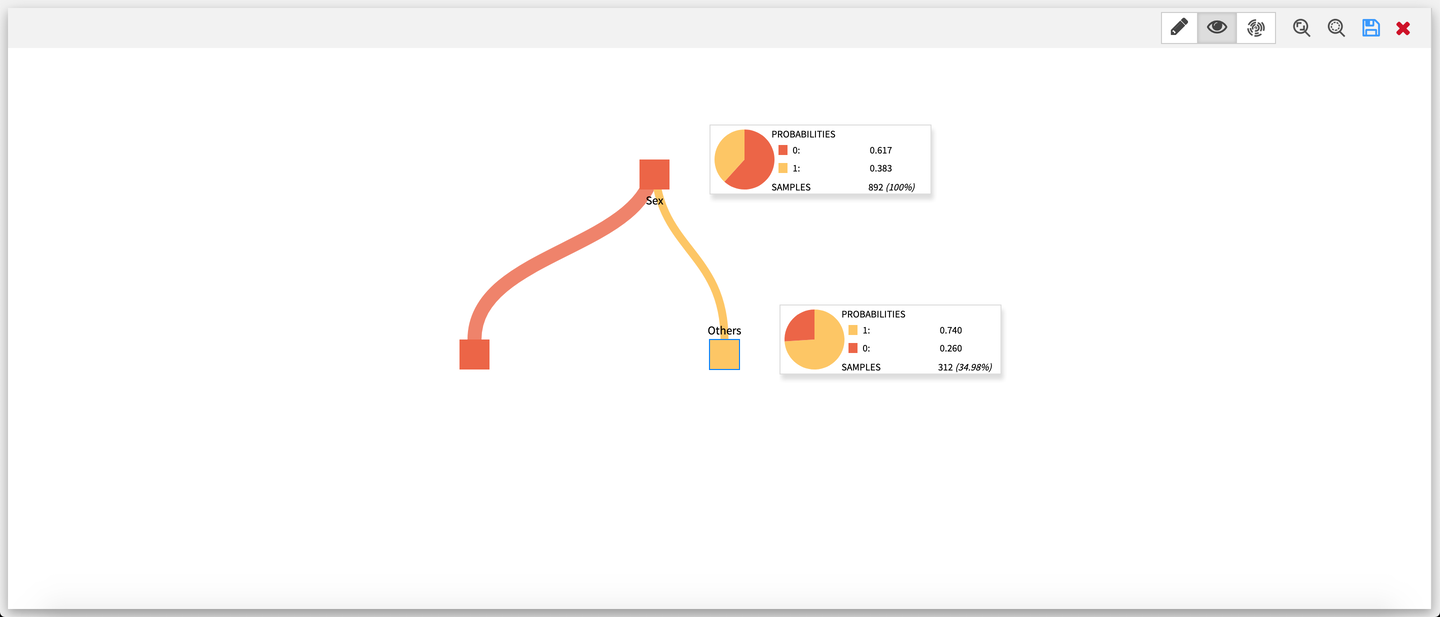
Tree visualization
This visualization mode features the tree of the edit mode in a full screen view. Every node of the tree has a tooltip displaying its main information (probabilities, samples), along with a pie chart of the target distribution.
Sunburst visualization
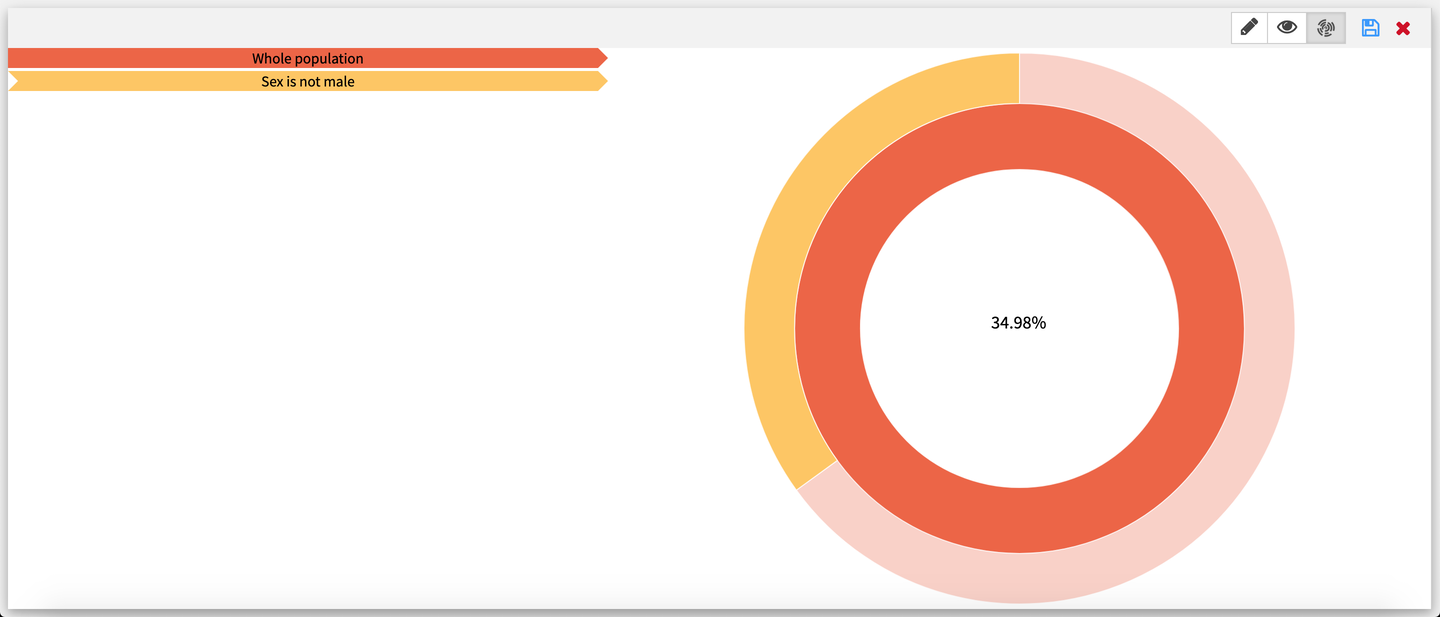
This visualization mode features the tree as a sunburst, with every arc corresponding to a node of the tree from the edit mode. When hovering upon an arc, the decision rule is displayed on the left. Clicking on an arc puts the selected arc in the center of the sunburst.
Since the size of an arc is proportional to the number of samples it has, some arcs may be too small to be displayed.
Score recipe
Use this recipe to score a dataset, using a decision tree made in the webapp as the prediction model.
Inputs:
Dataset with at least all the columns used by the decision tree. If the decision tree uses a numerical feature that has missing values in the input dataset, they are replaced with the mean of the feature in the dataset used to build the tree.
Folder containing a decision tree from the Interactive Decision Tree Builder webapp.
Output:
Scored dataset containing all input columns, or the selected columns, with extra columns:
Prediction.
(Optional) Probability of each class.
Decision rule.
Leaf ID.
Label (empty for leaves without a label).
Settings
Decision tree: The name of the JSON file where the decision tree is saved. Note that you must include the .json extension as well.
Batch size: The number of rows in each scoring batch. Defaults to 10,000.
Output probabilities: Whether to include the probabilities of each class in the scored dataset. Checked by default.
Input columns to include: Enable to retain only selected input columns in the output dataset.
Columns to keep: The input columns to retain. Available when Input columns to include is enabled.
Evaluate recipe
Use this recipe to evaluate a dataset, using a decision tree made in the webapp as the prediction model.
Inputs:
Dataset with at least all the columns used by the decision tree and the target column of the decision tree. If the decision tree uses a numerical feature that has missing values in the input dataset, they are replaced with the mean of the feature in the dataset used to build the tree.
Folder containing a decision tree JSON file from the Interactive Decision Tree builder webapp.
Output:
Evaluated dataset containing all input columns, or the selected columns, with extra columns:
Prediction.
(Optional) Probability of each class.
(Optional) Whether the prediction was correct.
Decision rule.
Leaf ID.
Label (empty for leaves without a label).
Metrics dataset
Settings
Decision tree: The name of the JSON file where the decision tree is saved. Note that you must include the .json extension as well.
Output probabilities: Whether to include the probabilities of each class in the evaluated dataset. Checked by default.
Check if prediction is correct: Whether to include a column indicating if the prediction matches the target. Checked by default.
Input columns to include: Enable to retain only selected input columns in the output dataset.
Columns to keep: The input columns to retain. Available when Input columns to include is enabled.
Filter metrics: Enable to select the metrics to include in the metrics dataset. Unchecked by default, so all available metrics are included.
Available metrics (only if Filter metrics is checked):
auc
recall
precision
accuracy
f1
log loss
hamming loss
calibration loss