
Model Document Generator
You can use the Model Document Generator to create documentation associated with any trained model. It will generate a Microsoft Word™ .docx file that provide information regarding:
What the model does
How the model was built (algorithms, features, processing, …)
How the model was tuned
What are the model’s performances
It allows you to prove that you followed industry best practices to build your model.
Generate a model document
Note
To use this feature, the graphical export library must be activated on your DSS instance. Please check with your administrator.
Once a model has been trained, you can generate a document from it with the following steps:
Go to the trained model you wish to document (either a model trained in a Visual Analysis of the Lab or a version of a saved model deployed in the Flow)
Click the
Actionsbutton on the top-right cornerSelect
Export model documentationOn the modal dialog, select the default template or upload your own template, and click
Exportto generate the documentAfter the document is generated, you will be able to download your generated model document using the
Downloadlink
Warning
Any placeholders starting with the keyword design will be linked to the current status of your visual analysis. If you change parameters in your model, DSS will consider that placeholder values are outdated and will replace these placeholders with blanks in the generated documentation.
If you delete your visual analysis and then generate a document from a saved model, any placeholders starting with the keyword design will not provide any result.
Custom templates
If you want the document generator to use your own template, you need to use Microsoft Word™ to create a .docx file.
You can create your base document as you would create a normal Word document, and add placeholders when you want to retrieve information from your model.
Sample templates
Instead of starting from scratch, you can modify the default templates:
Placeholders
A placeholder is defined by a placeholder name inside two brackets, like {{design.prediction_type.name}}. The generator will read the placeholder and replace it with the value retrieved from the model.
There are multiples types of placeholders, which can produce text, an image, or a table.

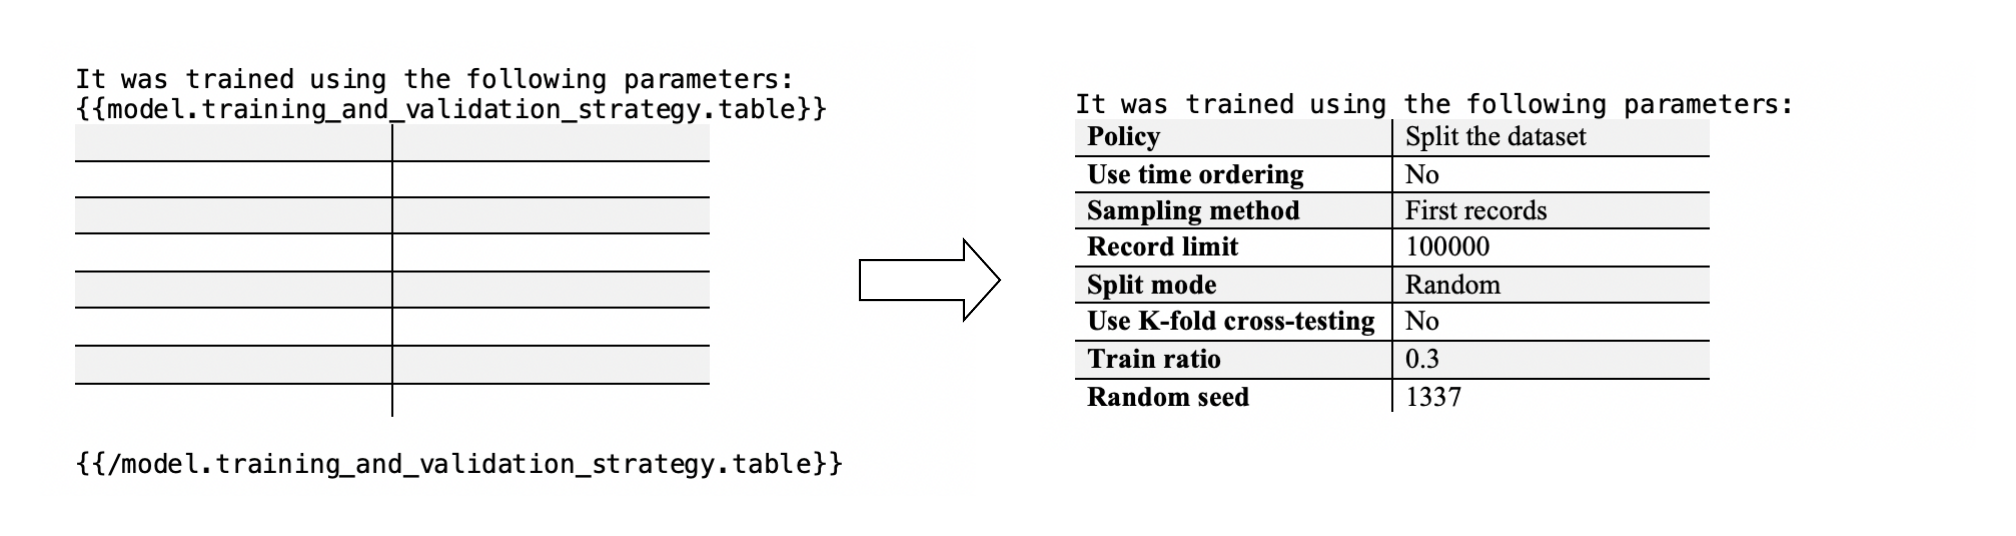
You can format the style of a table placeholder by using a block placeholder and placing an empty table inside it.
Conditional placeholders
If you want to build a single template able to handle several kinds of models, you may need to display information only when they are relevant. For example, you may want to describe what is a binary classification, but this description should only appear on your binary classification models. This can be achieved with a conditional placeholder.
A conditional placeholder contains three elements, each of them needs to be on a separate line:
a condition
a text to display if the condition is valid
a closing element
Example:
{{if design.prediction_type.name == Binary classification}}

The model {{design.prediction_type.name}} is a binary classification.

{{endif design.prediction_type.name}}
{{if design.prediction_type.name != Binary classification}}

The model {{design.prediction_type.name}} is a not binary classification.

{{endif design.prediction_type.name}}
The condition itself is composed of three parts:
a text placeholder
an operator (
==or!=)a reference value
Example:
{{if my.placeholder == myReferenceValue }}
During document generation, the placeholder is replaced by its value and compared to the reference value. If the condition is correct, the text is displayed, otherwise nothing will appear on the final document.
Parametrized result placeholders
In some advanced situations, you might want to include only certain parts of a component visible in the trained model report.
To do so, you can use the format {{result.your_component.plot/your_variable}} to select part of a component based on a specific dropdown. Make sure that your_variable is spelled correctly and matches an item from the dropdown.
For example, to export the feature dependence chart for a chosen feature, you can provide the placeholder {{result.feature_dependence.plot/Embarked}}, which will export the chart for the feature “Embarked”.
If a placeholder expects a parameter, it is specified in the “Description” column in the tables below.
Warning
Special characters (e.g. * # $ / “) are accepted in the parameter name.
However, curly brackets may interfere with the closing placeholder markers }} if it:
contains two or more consecutive closing brackets, like
your}}variablecontains two or more consecutive opening brackets, like
{{your_variablecontains one or more trailing closing brackets, like
your_variable}
Therefore, please rename your columns in these cases.
List of placeholders
Placeholders related to the dataset:
Name |
Compatibility |
Description |
|---|---|---|
dataset.prepare_steps.table |
All |
Preparation steps used on the dataset |
dataset.prepare_steps.status |
All |
Tell if preparation steps are used on the dataset |
Placeholders related to the design phase of a model:
Name |
Compatibility |
Description |
|---|---|---|
design.mltask.name |
All |
Name of the modeling task |
design.visual_analysis.name |
All |
Name of the visual analysis |
design.algorithm.name |
All |
Name of the algorithm used to compute the model |
design.target.name |
Prediction |
Name of the target variable |
design.features_count.value |
All |
Number of columns in the train set |
design.model_type.name |
All |
Type of model (Prediction or Clustering) |
design.prediction_type.name |
Prediction |
Type of prediction (Regression, Binary classification or Multi-class classification) |
design.target_proportion.plot |
Classification |
Proportions of classes in the guess sample |
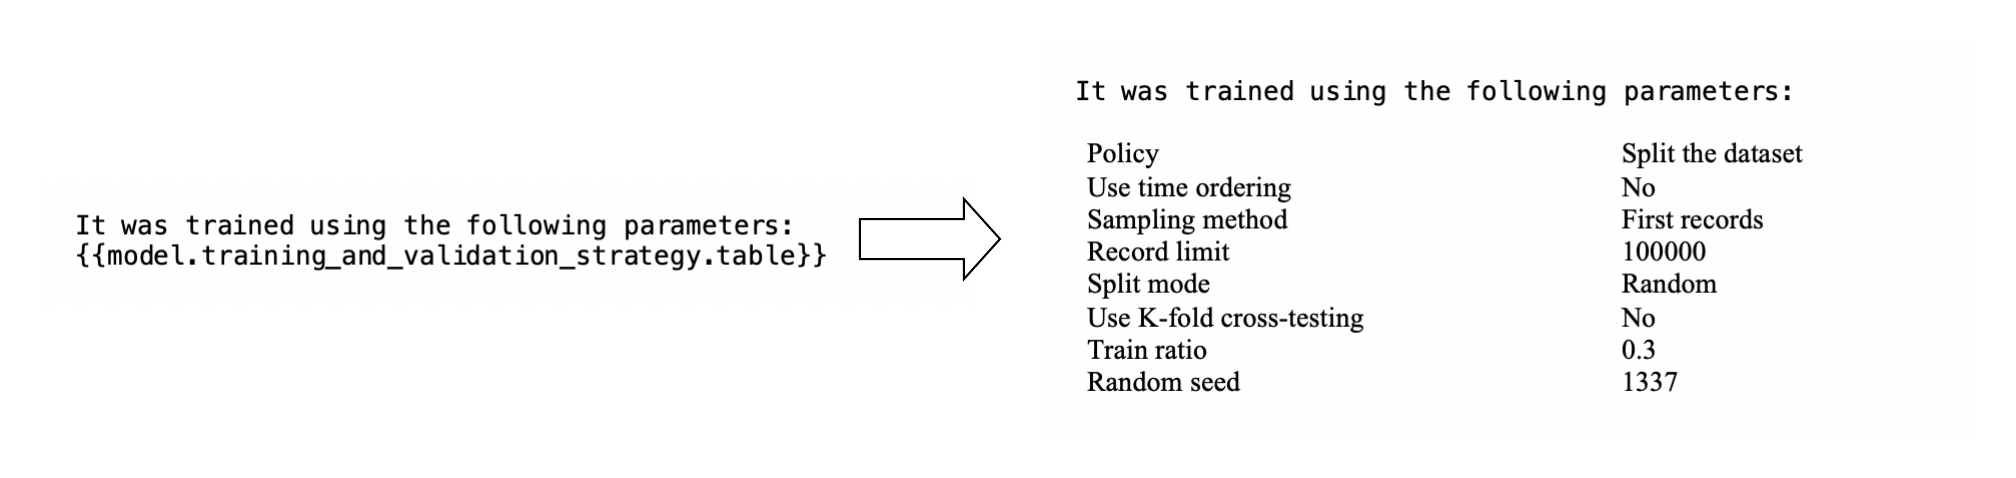
design.training_and_testing_strategy.table |
Prediction |
Strategy used to train and test the model |
design.training_and_testing_strategy.policy.value |
Prediction |
Name of the policy used to train and test the model |
design.sampling_method.value |
Prediction |
Sampling method named used to train and test the model |
design.k_fold_cross_testing.value |
Prediction |
Tell if the K-fold strategy was used to train and test the model |
design.sampling_and_splitting.image |
Prediction |
Sampling and splitting strategy used to train and test the model |
design.sampling.image |
Time series forecasting |
Sampling strategy used to train and test the model |
design.splitting.image |
Time series forecasting |
Splitting strategy used to train and test the model |
design.train_set.image |
Prediction |
Explicit train set strategy |
design.test_set.image |
Prediction |
Explicit test set strategy |
design.test_metrics.name |
Prediction |
Metric used to optimize model hyperparameters |
design.input_feature.table |
All |
Summary of input features |
design.feature_generation_pairwise_linear.value |
Prediction |
Display if pairwise linear combinations are used in the feature generation |
design.feature_generation_pairwise_polynomial.value |
Prediction |
Display if pairwise polynomial combinations are used in the feature generation |
design.feature_generation_explicit_pairwise.status |
Prediction |
Display if the model contains explicit pairwise interactions used in the feature generation |
design.feature_generation_explicit_pairwise.table |
Prediction |
Display explicit pairwise interactions used in the feature generation |
design.feature_reduction.image |
Prediction |
Reduction method applied to the model |
design.feature_reduction.name |
Prediction |
Name of the feature reduction applied to the model |
design.chosen_algorithm_search_strategy.table |
All |
List the parameters used to configure the chosen algorithm |
design.chosen_algorithm_search_strategy.text |
All |
Description of the chosen algorithm |
design.other_algorithms_search_strategy.table |
All |
Parameters and description of the other computed algorithms |
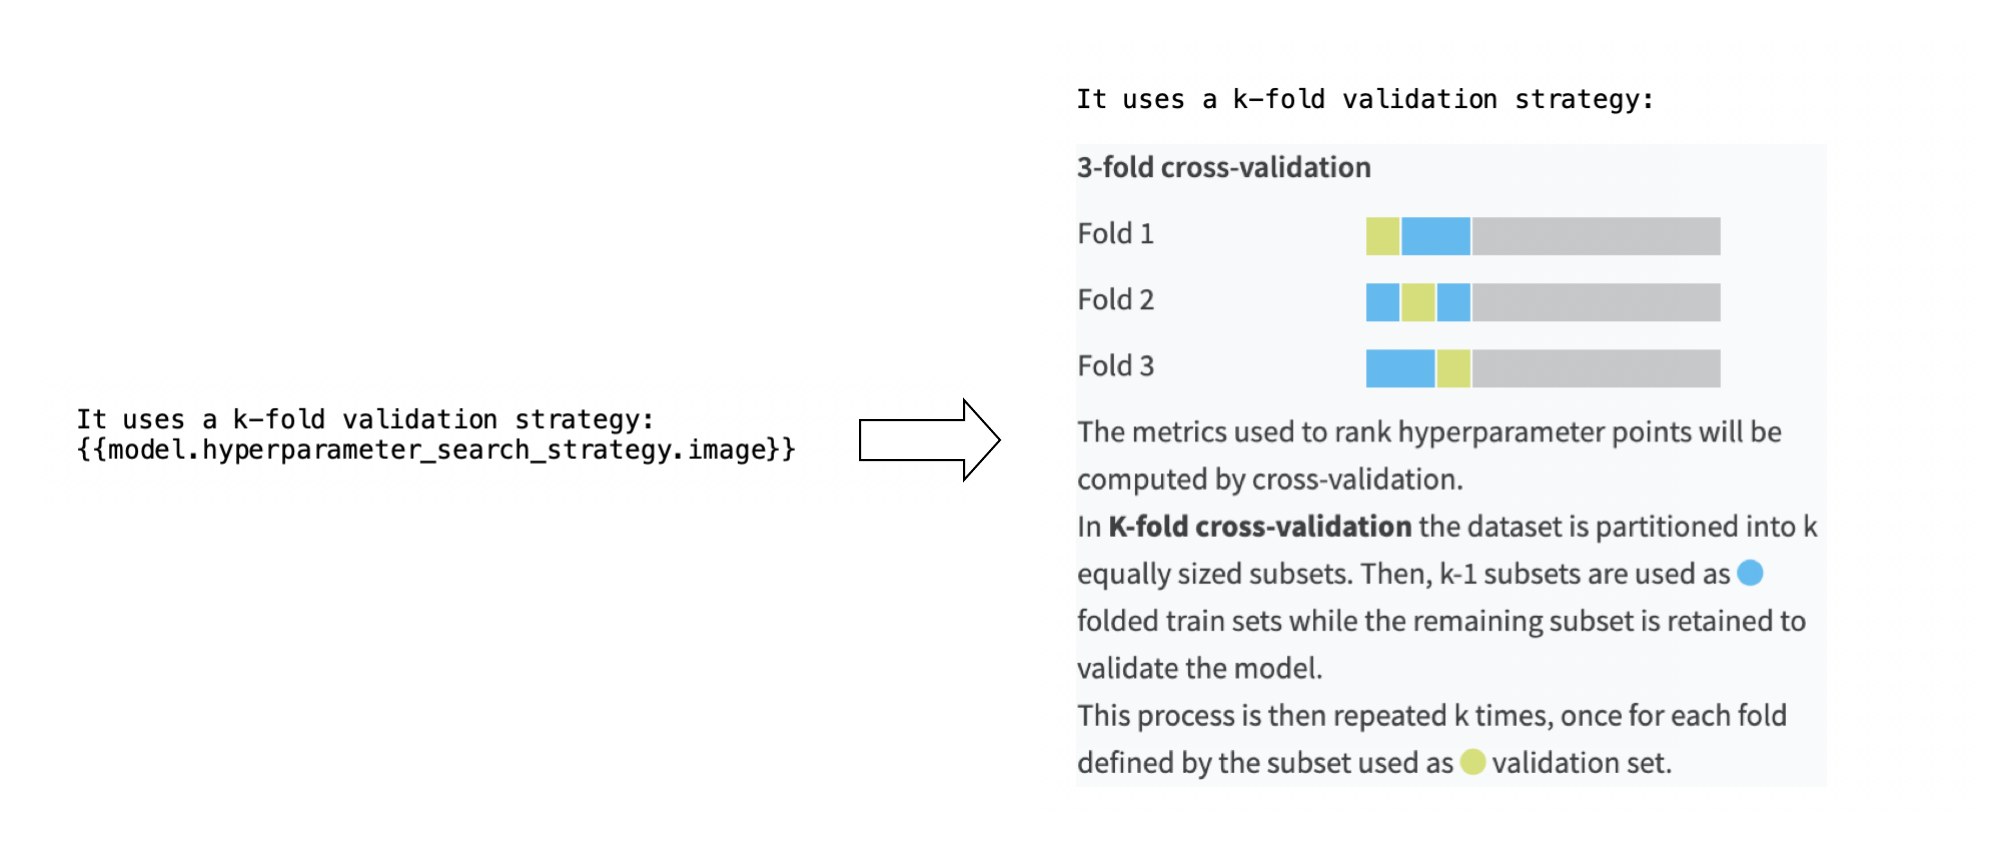
design.hyperparameter_search_strategy.image |
Prediction |
Hyperparameter search strategy used to compute the model |
design.hyperparameter_search_strategy.table |
Prediction |
Summary of the hyperparameter search strategy |
design.cross_validation_strategy.value |
Prediction |
Name of cross-validation strategy used on hyperparameters |
design.dimensionality_reduction.table |
Clustering |
Dimensionality reduction used to compute the model |
design.dimensionality_reduction.status |
Clustering |
Tell if a dimensionality reduction was used to compute the model |
design.outliers_detection.table |
Clustering |
Outliers detection strategy used to compute the model |
design.outliers_detection.status |
Clustering |
Tell if an outliers detection strategy was used to compute the model |
design.weighting_strategy.method.name |
Prediction |
Name of the weighting strategy |
design.weighting_strategy.variable.name |
Prediction |
Name of the weighting strategy associated variable |
design.weighting_strategy.text |
Prediction |
Description of a weighting strategy |
design.calibration_strategy.name |
Classification |
Name of the probability calibration method |
design.calibration_strategy.text |
Classification |
Description of a probability calibration strategy |
design.backend.name |
All |
Name of the backend engine |
design.partitioned_model.status |
All |
Tell if the current model is a partitioned model |
design.time_variable.name |
Time series forecasting |
Name of the time variable |
design.num_timeseries.value |
Time series forecasting |
Number of time series to forecast |
design.timeseries_identifiers.value |
Time series forecasting |
List of columns containing time series identifier values |
design.has_multiple_timeseries.value |
Time series forecasting |
Whether the model has multiple time series |
design.time_step.value |
Time series forecasting |
Time step including its unit |
design.forecast_horizon.in_units.value |
Time series forecasting |
Forecast horizon including its unit |
design.forecast_horizon.time_steps.value |
Time series forecasting |
Number of time steps in one forecast horizon |
design.timeseries_num_external_features.value |
Time series forecasting |
Number of external features provided to the model |
design.timeseries_external_features.value |
Time series forecasting |
List of external features columns |
design.timeseries_scoring_data_length.value |
Time series forecasting |
How much past data must be provided for scoring |
design.timeseries_algorithm_can_score_new_series.value |
Time series forecasting |
Whether the current model can score time series unseen during training |
design.timeseries_general_settings.table |
Time series forecasting |
List the general time series specific settings used to configure the model |
design.timeseries_forecasting.table |
Time series forecasting |
List the settings used to configure the forecast horizon |
design.forecasting_parameters.image |
Time series forecasting |
Forecasting parameters shown visually in a diagram |
Placeholders related to the result of a model computation:
Name |
Compatibility |
Description |
|---|---|---|
result.chosen_algorithm.name |
All |
Name of the algorithm selected for the mode used in the current document generation |
result.train_set.sample_rows_count.value |
All |
Number of rows in the train set |
result.test_metrics.value |
Prediction |
Value of the test metrics |
result.target_value.positive_class.value |
Binary classification |
Name of the target value representing the positive class |
result.target_value.negative_class.value |
Binary classification |
Name of the target value representing the negative class |
result.threshold_metric.name |
Binary classification |
Name of the threshold (cut off) metric |
result.classification_threshold.current.value |
Binary classification |
Current value of the threshold metric |
result.classification_threshold.optimal.value |
Binary classification |
Optimal value of the threshold metric |
result.chosen_algorithm_details.image |
All but partitioned models |
Summary of the prediction computation |
result.chosen_algorithm_details.table |
All but partitioned models |
Summary of the current model selected hyperparameters |
result.cluster_summary.image |
Clustering |
Summary of the clustering computation |
result.cluster_description.image |
Clustering |
Description of each category of the clustering |
result.partitioned.summary.image |
Prediction |
Summary of the partitioned model execution |
result.decision_trees.image |
Prediction |
Random forest decision tree visualisation |
result.decision_trees.status |
All |
Tell if the model is compatible with a decision tree visualisation |
result.regression_coefficients.image |
Regression and binary classification |
Regression coefficient chart |
result.regression_coefficients.status |
All |
Tell if the model has a regression coefficient chart |
result.feature_importance.plot |
Prediction |
Feature importance chart |
result.feature_importance.status |
All |
Does the model have feature importance charts |
result.absolute_importance.plot |
Prediction |
Absolute importance chart |
result.absolute_importance.status |
All |
Does the model have an absolute importance chart |
result.feature_effects.plot |
Prediction |
Feature effects chart |
result.feature_dependence.plot/your_feature |
Prediction |
Parametrized placeholder. Feature dependence chart for your selected feature. |
result.individual_explanations.image |
Prediction |
Individual explanation chart |
result.individual_explanations.text |
Prediction |
Description of the individual explanation chart |
result.individual_explanations.status |
All |
Tell if the model contains an individual explanation chart |
result.hyperparameter_search.plot |
Prediction |
Hyperparameter search results as a chart |
result.hyperparameter_search.table |
Prediction |
Displays data associated to the hyperparameter search as an table |
result.hyperparameter_search.status |
All |
Tell if the model had a hyperparameter search results chart |
result.confusion_matrix.image |
Classification |
Confusion matrix results as a table |
result.confusion_matrix_table.text |
Binary classification |
Description of the confusion matrix |
result.confusion_matrix_metrics.plot |
Classification |
Metrics associated to the confusion matrix |
result.confusion_matrix_metrics.text |
Classification |
Description of the different metrics |
result.cost_matrix.image |
Binary classification |
Cost matrix as a table |
result.cost_matrix.image |
Binary classification |
Cost matrix as a table |
result.cost_matrix.text |
Binary classification |
Description of the cost matrix |
result.decision_chart.plot |
Binary classification |
Decision chart |
result.decision_chart.text |
Binary classification |
Description of the decision chart |
result.lift_curve.plot |
Binary classification |
Lift curve charts |
result.lift_curve.text |
Binary classification |
Description of the lift curve charts |
result.calibration.plot |
Classification |
Calibration curve chart |
result.calibration.text |
Classification |
Description of the calibration curve chart |
result.roc_curve.plot |
Classification |
ROC curve chart |
result.roc_curve.text |
Classification |
Description of the ROC curve chart |
result.pr_curve.plot |
Classification |
PR curve chart |
result.pr_curve.text |
Classification |
Description of the PR curve chart |
result.density_chart.plot |
Classification |
Density chart |
result.density_chart.text |
Classification |
Description of the density chart |
result.hierarchy.plot |
Clustering |
Hierarchy of the interactive clustering model |
result.anomalies.plot |
Clustering |
Anomalies detected displayed as a heatmap |
result.cluster_heat_map.plot |
Clustering |
Features heatmap |
result.scatter.plot |
Regression and clustering |
Scatter plot chart |
result.error_distribution.table |
Regression |
Error distribution as a table |
result.error_distribution.plot |
Regression |
Error distribution as a chart |
result.error_distribution.text |
Regression |
Description of the error distribution |
result.detailed_metrics.table |
All |
Detailed summary of the model computation |
result.ml_assertions.table |
Prediction |
Assertions definitions and metrics |
result.ml_overrides.definition.table |
Prediction |
Model overrides definitions |
result.ml_overrides.metrics.table |
Prediction |
Model overrides metrics |
result.timings.table |
All |
Time of the different execution steps |
result.diagnostics.table |
All |
All Diagnostics for the current model |
result.diagnostics.table.dataset_sanity_checks |
All |
Diagnostics of type dataset sanity checks for the current model |
result.diagnostics.table.modeling_parameters |
All |
Diagnostics of type modeling parameters for the current model |
result.diagnostics.table.runtime |
All |
Diagnostics of type runtime that check the model training speed |
result.diagnostics.table.training_overfit |
All |
Diagnostics of type training overfit for the current model |
result.diagnostics.table.leakage_detection |
All |
Diagnostics of type leakage detection for the current model |
result.diagnostics.table.model_check |
All |
Diagnostics of type model check for the current model |
result.diagnostics.table.reproduciblity |
All |
Diagnostics of type training reproducibility for the current model |
result.diagnostics.table.ml_assertions |
All |
Diagnostics of type ML assertions for the current model |
result.diagnostics.table.abnormal_predictions_detection |
All |
Diagnostics of type abnormal predictions detection for the current model |
result.diagnostics.table.timeseries_resampling_checks |
Time series forecasting |
Diagnostics of type resampling checks for the current model |
result.full_log.link |
All |
URL to download the model’s logs |
result.training_date.name |
All |
Date of the training |
result.leaderboard.image |
All |
Image of the default leaderboard of the computed models |
result.leaderboard.accuracy.image |
Classification |
Image of the leaderboard of the computed models for the metric accuracy |
result.leaderboard.precision.image |
Classification |
Image of the leaderboard of the computed models for the metric precision |
result.leaderboard.recall.image |
Classification |
Image of the leaderboard of the computed models for the metric recall |
result.leaderboard.f1.image |
Classification |
Image of the leaderboard of the computed models for the metric F1 score |
result.leaderboard.cost_matrix.image |
Classification |
Image of the leaderboard of the computed models for the metric cost matrix gain |
result.leaderboard.log_loss.image |
Classification |
Image of the leaderboard of the computed models for the metric log loss |
result.leaderboard.roc_auc.image |
Classification |
Image of the leaderboard of the computed models for the metric ROC AUC |
result.leaderboard.average_precision.image |
Classification |
Image of the leaderboard of the computed models for the metric Average Precision score |
result.leaderboard.calibration_loss.image |
Binary classification |
Image of the leaderboard of the computed models for the metric calibration loss |
result.leaderboard.lift.image |
Binary classification |
Image of the leaderboard of the computed models for the metric lift |
result.leaderboard.evs.image |
Regression |
Image of the leaderboard of the computed models for the metric EVS |
result.leaderboard.mape.image |
Regression and time series forecasting |
Image of the leaderboard of the computed models for the metric MAPE |
result.leaderboard.mae.image |
Regression and time series forecasting |
Image of the leaderboard of the computed models for the metric MAE |
result.leaderboard.mse.image |
Regression and time series forecasting |
Image of the leaderboard of the computed models for the metric MSE |
result.leaderboard.rmse.image |
Regression and time series forecasting |
Image of the leaderboard of the computed models for the metric RMSE |
result.leaderboard.rmsle.image |
Regression |
Image of the leaderboard of the computed models for the metric RMSLE |
result.leaderboard.r2.image |
Regression |
Image of the leaderboard of the computed models for the metric R2 score |
result.leaderboard.correlation.image |
Regression |
Image of the leaderboard of the computed models for the metric correlation |
result.leaderboard.mase.image |
Time series forecasting |
Image of the leaderboard of the computed models for the metric MASE |
result.leaderboard.smape.image |
Time series forecasting |
Image of the leaderboard of the computed models for the metric SMAPE |
result.leaderboard.mean_absolute_quantile_loss.image |
Time series forecasting |
Image of the leaderboard of the computed models for the metric Mean absolute quantile loss |
result.leaderboard.mean_weighted_quantile_loss.image |
Time series forecasting |
Image of the leaderboard of the computed models for the metric Mean weighted quantile loss |
result.leaderboard.msis.image |
Time series forecasting |
Image of the leaderboard of the computed models for the metric MSIS |
result.leaderboard.nd.image |
Time series forecasting |
Image of the leaderboard of the computed models for the metric ND |
result.leaderboard.silhouette.image |
Clustering |
Image of the leaderboard of the computed models for the metric silhouette |
result.leaderboard.inertia.image |
Clustering |
Image of the leaderboard of the computed models for the metric inertia |
result.leaderboard.clusters.image |
Clustering |
Image of the leaderboard of the computed models for the metric clusters number |
result.has_multiple_timeseries.value |
Time series forecasting |
Whether the model has multiple time series |
result.has_information_criteria.value |
Time series forecasting |
Whether the model exposes information criteria values (e.g AIC) |
result.has_model_coefficients.value |
Time series forecasting |
Whether the model exposes model coefficients (e.g regression coefficients) |
result.is_statistical_timeseries_model.value |
Time series forecasting |
Whether the model uses a statistical algorithm (e.g. AutoARIMA) |
result.timeseries_resampling.table |
Time series forecasting |
Parameters defining how the time series is resampled |
result.per_timeseries_metrics.table |
Time series forecasting |
For a multi time series model, the metrics for each time series |
result.autoarima_orders_single.table |
Time series forecasting |
For a single time series model trained with the AutoARIMA algorithm, the ARIMA orders |
result.autoarima_orders_multi.table |
Time series forecasting |
For a multi time series model trained with the AutoARIMA algorithm, the ARIMA orders for each time series |
result.timeseries_coefficients_single.table |
Time series forecasting |
For a single time series statistical model, the values of model coefficients |
result.timeseries_coefficients_multi.table |
Time series forecasting |
For a multi time series statistical model, the values of model coefficients for each time series |
result.information_criteria_single.table |
Time series forecasting |
For a single time series AutoARIMA or STL model, the values of information criteria |
result.information_criteria_multi.table |
Time series forecasting |
For a multi time series AutoARIMA or STL model, the values of information criteria for each time series |
result.timeseries_single_forecast.plot |
Time series forecasting |
For a single time series model, the forecast chart |
result.timeseries_multi_forecast.plot |
Time series forecasting |
For a multi time series model, the first five forecast charts |
Placeholders related to the DSS configuration:
Name |
Compatibility |
Description |
|---|---|---|
config.author.name |
All |
Name of the user that launched the generation |
config.author.email |
All |
E-mail of the user that launched the generation |
config.environment.name |
All |
Name of the DSS environment |
config.dss.version |
All |
Current version of DSS |
config.is_saved_model.value |
All |
Yes when documenting a model exported into the Flow, No otherwise |
config.generation_date.name |
All |
Generation date of the output document |
config.project.link |
All |
URL to access the project |
config.output_file.name |
All |
Name of the generated file |
List of conditional placeholders
Placeholders that can be used as conditional placeholders:
dataset.prepare_steps.status
design.mltask.name
design.visual_analysis.name
design.algorithm.name
design.target.name
design.features_count.value
design.model_type.name
design.prediction_type.name
design.training_and_validation_strategy.policy.value
design.sampling_method.value
design.k_fold_cross_testing.value
design.feature_generation_pairwise_linear.value
design.feature_generation_pairwise_polynomial.value
design.feature_generation_explicit_pairwise.status
design.feature_reduction.name
design.chosen_algorithm_search_strategy.text
design.cross_validation_strategy.value
design.dimensionality_reduction.status
design.outliers_detection.status
design.weighting_strategy.method.name
design.weighting_strategy.variable.name
design.calibration_strategy.name
design.backend.name
design.partitioned_model.status
design.has_multiple_timeseries.value
design.timeseries_algorithm_can_score_new_series.value
result.chosen_algorithm.name
result.train_set.sample_rows_count.value
result.target_value.positive_class.value
result.target_value.negative_class.value
result.threshold_metric.name
result.classification_threshold.current.value
result.classification_threshold.optimal.value
result.decision_trees.status
result.regression_coefficients.status
result.feature_importance.status
result.individual_explanations.status
result.hyperparameter_search.status
result.training_date.name
config.author.name
config.author.email
config.environment.name
config.dss.version
config.is_saved_model.value
config.generation_date.name
config.output_file.name
Deprecated placeholders
Name |
Compatibility |
Description |
Replaced by |
|---|---|---|---|
result.detailed_metrics.image |
All |
Detailed summary of the model computation |
result.detailed_metrics.table |
design.other_algorithms_search_strategy.image |
All |
Image of the parameters and description of the other computed algorithms |
design.other_algorithms_search_strategy.table |
design.chosen_algorithm_search_strategy.image |
All |
Image of the parameters used to configure the chosen algorithm |
design.chosen_algorithm_search_strategy.table |
Limitations
You need to upgrade the table of contents manually after a document generation
The Model Document Generator is currently not compatible with ensemble models
The Model Document Generator is currently not compatible with Keras nor computer vision models
The Model Document Generator is currently not compatible with models imported from MLflow
The Model Document Generator is not compatible with plugin algorithms
When generating a document from a visual analysis, the model document generator will not display outdated design information. To fix this issue, you can either run a new analysis or revert the design to match the analysis
When generating a document from a saved model version, some information may be extracted from the original Visual Analysis Design settings. As a result, any placeholders starting with
designwill be empty when the Visual Analysis was modified or erasedEach part of a conditional placeholder must necessarily be in a new line
Table and conditional placeholders are not supported on headers and footers