
Monitoring model instances
DSS provides a monitoring modal for local Hugging Face models. It shows the status and recent activity of deployed instances, as well as live serving performance when available.
To inspect a model, open its model instance status from the Local Hugging Face connection model list.
The modal shows aggregated metrics of the models, including:
Number of model instances
Request rate
Input and output throughput
Number of running requests
Number of queued requests
Note
You can also monitor local models programmatically with the Python API.
Metrics
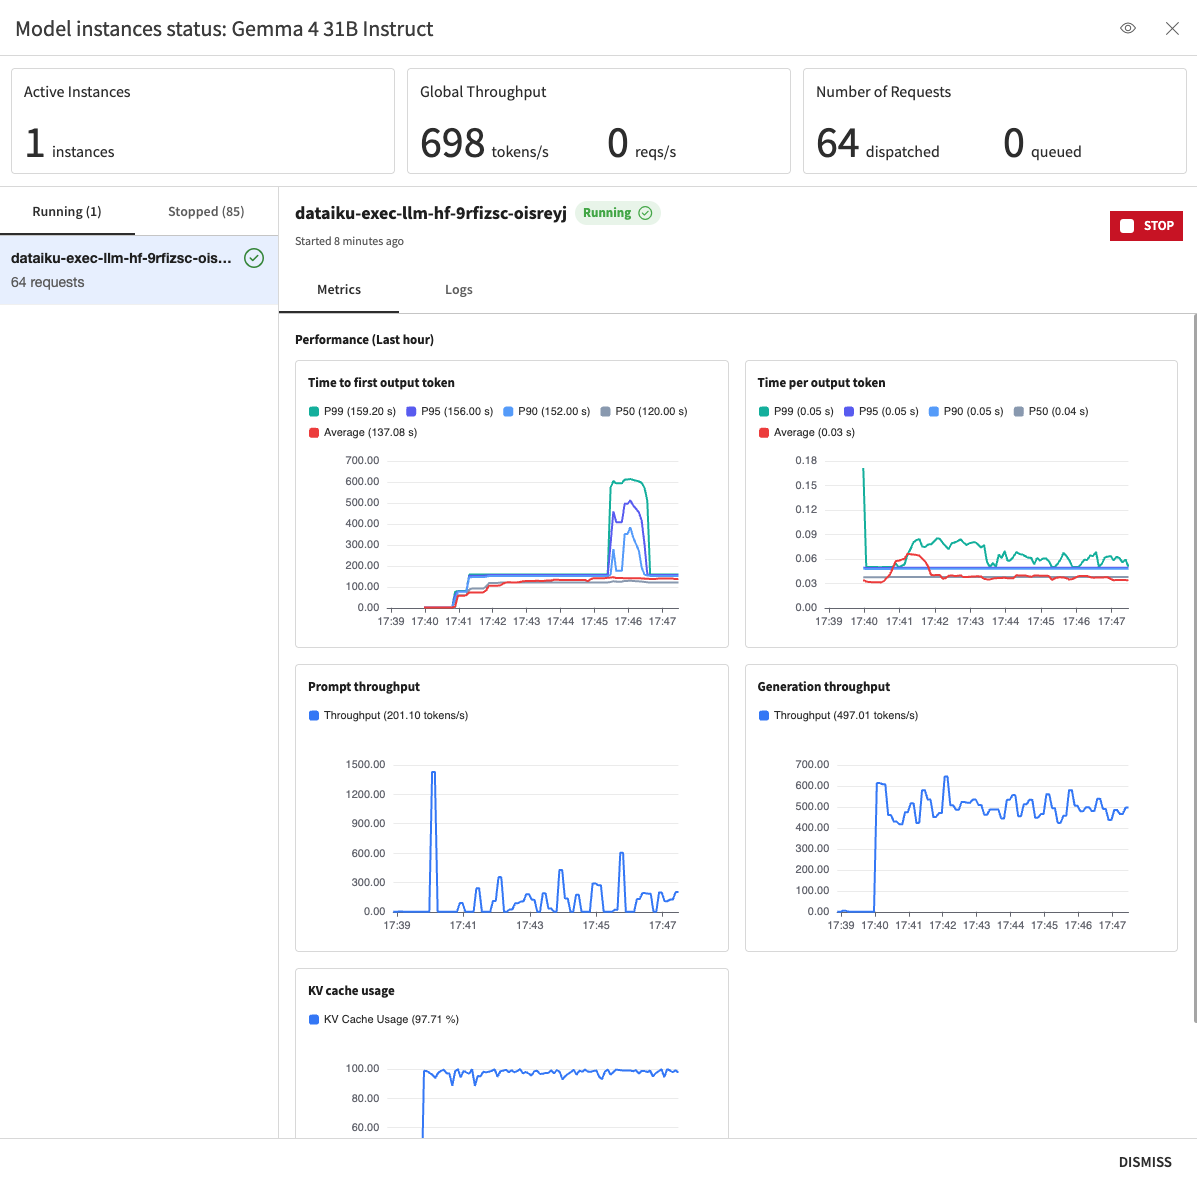
For models served with vLLM, DSS displays live charts when available. For text generation models, these can include:
Inter-token latency, also known as time per output token
Time to first token
Input throughput, that is, the number of input tokens processed per second
Output throughput, that is, the number of generated tokens per second
KV cache usage
Logs
The logs view shows the available log tail for the selected instance. Use it to diagnose model startup issues, runtime failures, or serving slowdowns.
Logs remain available after an instance stops, but live metrics are no longer available.