
Performance assessment
Object detection
Confusion matrix and image feed
Once the training is finished, results are available via a confusion matrix and the corresponding image feed.
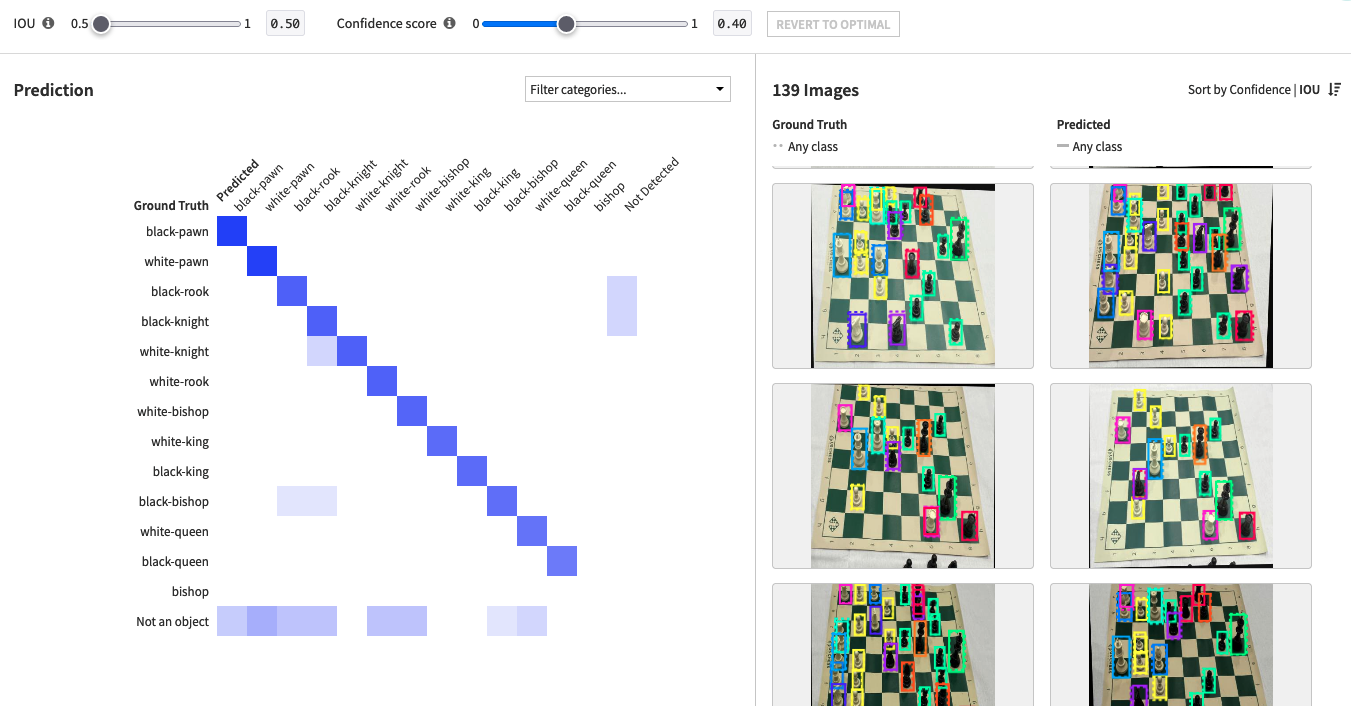
The confusion matrix shows the ground truth (rows) vs what the model predicted (columns). For every cell, the number of detections is displayed and permits filtering the image feed to show the corresponding images. You can then easily check if an object has been detected, and assigned the correct class label.
The “Not detected” column shows ground truth objects that weren’t detected during prediction
The “Not an object” row shows predicted objects that have no corresponding ground truth. Some objects may have not been labeled but were still detected by the model.
Moving the IOU (Intersection Over Union) slider will filter predictions, only showing those that have a higher IOU than the threshold. Increasing the confidence score threshold will filter out predictions that the model was less sure about. This confidence score threshold will also be applied when scoring the model using recipes or via the API node. The “back to optimal” button reset the confidence score to its optimal value.
Selecting a cell in the matrix, or modifying the IOU or Confidence Score sliders, updates the image feed according to those filters. You can also visualize all the predictions of the model for a given image by clicking on it. It displays objects that were correctly predicted with respect to their ground truths.
Metrics
The Metrics tab displays the table of the Average Precision for different IOU values, for all classes as well as individual classes. The higher the value, the better the prediction.
Precision-Recall curve
The Precision-Recall curve shows individual metrics for each detection (sampled). Moving the IOU slider modifies the displayed curve because only the bounding boxes with a higher proportion of intersection are included with a higher threshold, with the remaining boxes considered as erroneous detections (false positives). The confidence score is chosen to maximize the metric that was specified in the design.
What if : Scoring new images on the go
The “What if” tab allows you to score images on the go using the newly trained model, and to visualize the bounding boxes of the detected objects on the images. Drag & drop (or browse your files) to select one or many images to score.
Once inference is complete, the detections will appear on the right of the screen, along with their confidence score.
Only the detections with scores above the confidence threshold will appear on the image. This threshold can be changed dynamically to visualize the impact it has on the detected objects. Hovering the detections in the list will highlight the corresponding box on the image, regardless of whether their score meets the threshold.
If the model did not recognize any objects in your image, you will see a “Model did not detect any objects for this image” message instead of a list of detections.
Image classification
Confusion matrix and image feed
Once the training is finished, results are available via a confusion matrix and the corresponding image feed.
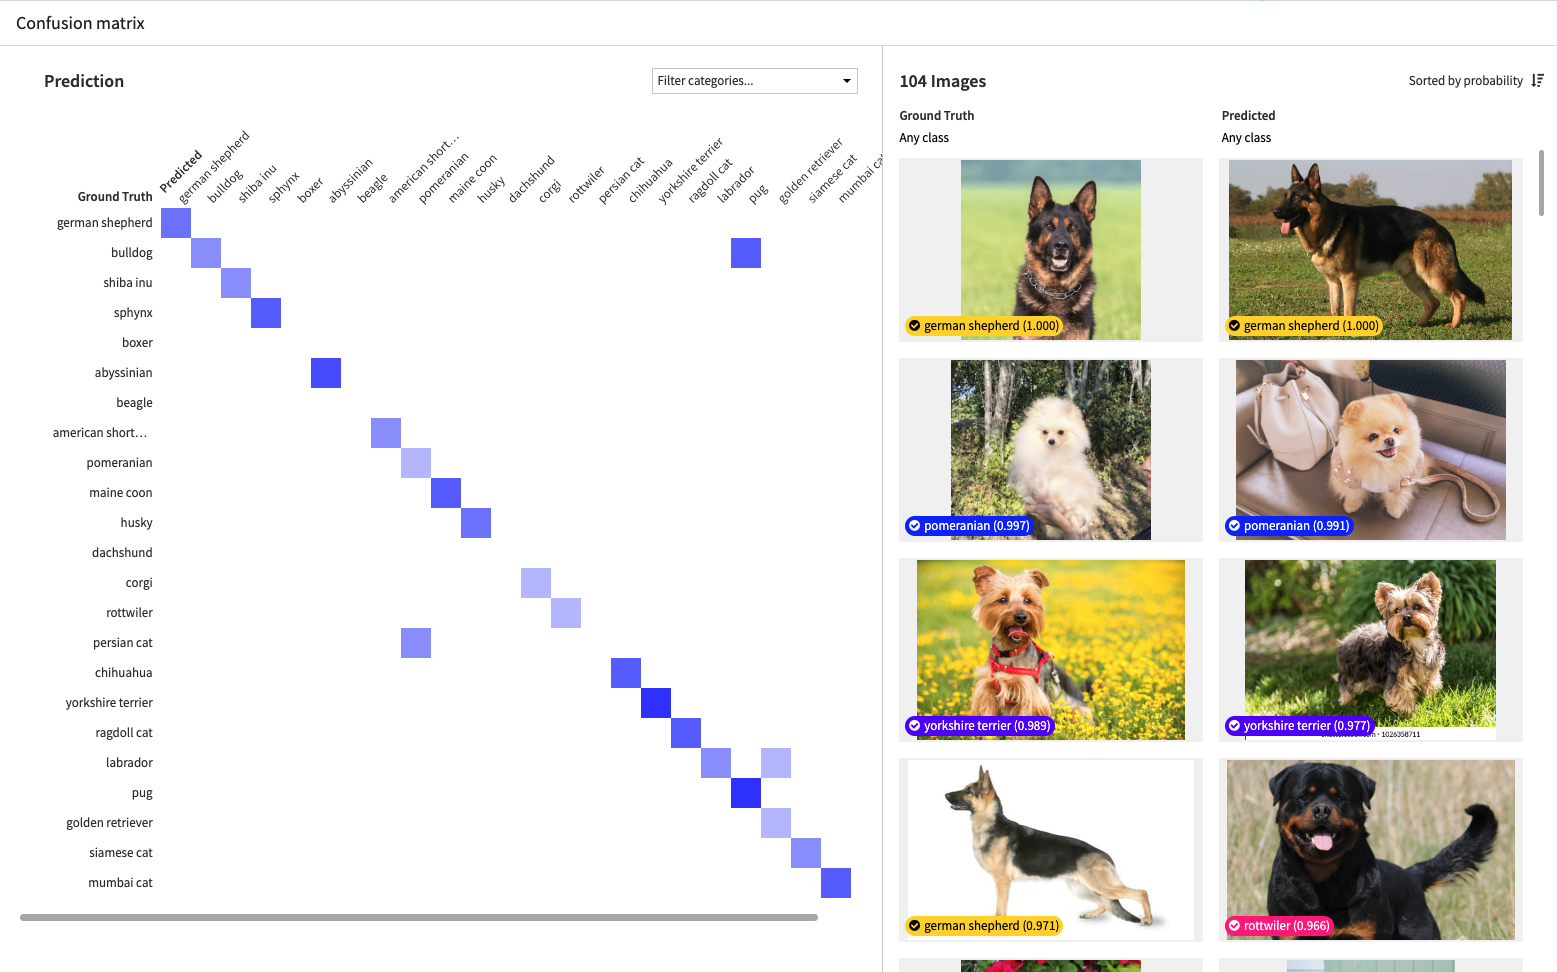
The confusion matrix shows the ground truth (rows) vs what the model predicted (columns). For every cell, the number of corresponding images is displayed. Selecting a cell in the matrix updates the image feed according to this filter. This way you can easily check which images have been assigned the correct (or incorrect) class labels.
You can also visualize the detail of the predicted probabilities for a given image by clicking on it. It displays the predicted probability of each class and indicates for the top class whether it was correctly predicted with respect to the ground truth of this image.
Metrics
The Metrics tab displays the main multi-classes metrics. You can hover over the metrics for more details on how each metric is computed.
Calibration curve, ROC curve & density charts
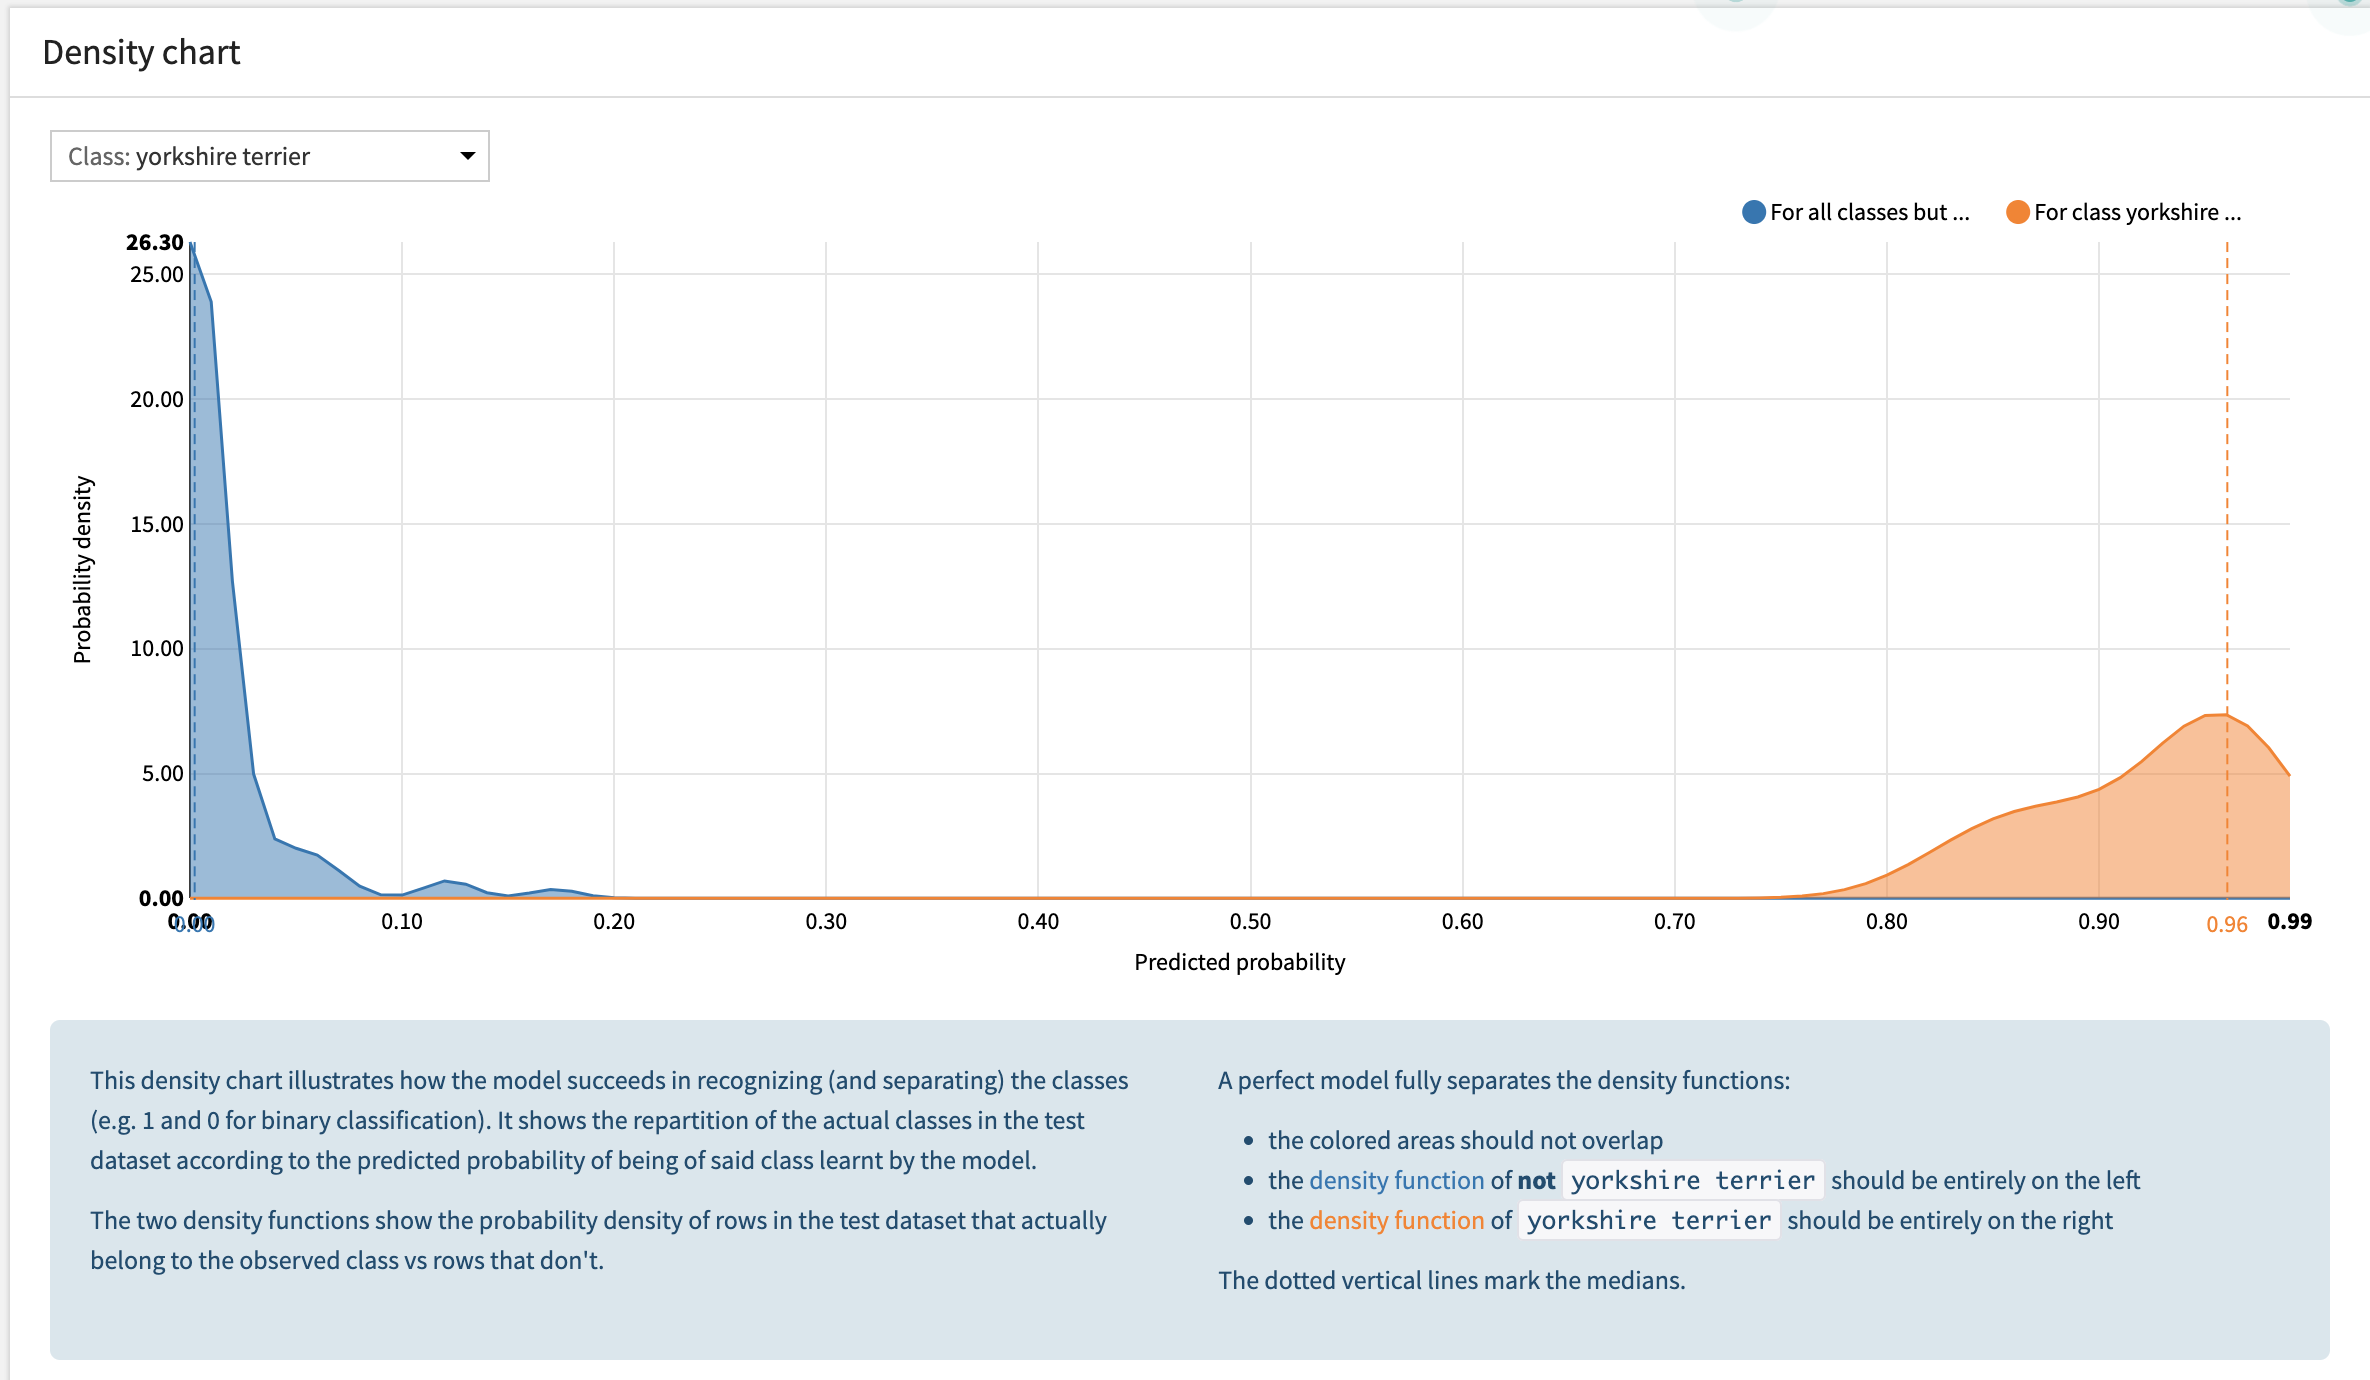
These graphs are computed for all the 1-versus-all subproblems as binary subproblems.
What if : Scoring new images on the go
Similarly to object detection, the “What if” tab for image classification allows you to score images on the go using the newly trained model. The predicted classes and their probabilities will appear on the right of the screen.