Visual Graph Explorer
Overview
The Visual Graph Explorer is a read-only Dataiku webapp designed for business users and analysts to perform in-depth visual exploration of graphs exposed through the webapp.
These graphs can come from Dataiku Folders published from Visual Graph and, when configured, unmanaged Neo4j databases.
Note
Get started by following this Explorer webapp tutorial.
Key features
- Schema overviewView the graph’s structure, including all node and edge groups.
- Visual explorationVisualize graphs with different layouts, merge parallel edges to simplify dense views, expand neighbors to explore relationships, apply conditional styling based on node properties, and inspect query results in graph or table views.
- Saved queriesExecute a library of saved Cypher queries prepared by data scientists to answer common business questions.
- Ad hoc queryingWrite and run custom Cypher queries directly within the interface with schema-aware autocompletion.
- Query generatorUse a built-in LLM assistant to generate Cypher queries from natural language questions.
- Dashboard insightsCreate a static insight from the current query result and add it to a dashboard.
Note
All schema design, data mapping and visual customization are performed beforehand in the Visual Graph Editor webapp.
For unmanaged Neo4j databases exposed directly in the Explorer, the webapp infers the available schema from the database and does not rely on a published Visual Graph configuration or on a graph being materialized in a Dataiku Folder first.
Settings
- Graph databases
Folder(s) containing the graph databases: select one or multiple Dataiku Folders containing graph databases published from Visual Graph. Leave this empty if you only want to expose unmanaged Neo4j databases directly in the Explorer.
Neo4j connection: if some selected folders represent a Neo4j graph database, or if you want to expose unmanaged Neo4j databases built outside Visual Graph, configure the connection to be used by the webapp.
Unmanaged Neo4j databases: select one or multiple unmanaged Neo4j databases to expose in the Explorer through the selected Neo4j connection. No Dataiku Folder materialization is required for these databases.
Note
Only one Neo4j connection can be used for all selected folders and unmanaged Neo4j databases in a given Explorer webapp.
To access Neo4j databases available through different connections, you will need to create separate Explorer webapps for each connection.
- AI assistant
LLM connection to use (Optional): select a LLM connection to enable the AI-powered Query generator. It helps users construct complex Cypher queries using natural language.
LLM history dataset (Optional): select the dataset storing the history of all questions asked by users in the Query generator. It can be used for auditing or analysis.
- Advanced settings
Cypher query timeout (seconds): set a maximum execution time for queries run within the Explorer. This acts as a guardrail to prevent resource-intensive queries from impacting performance.
Log level: configure the verbosity of the logs. Select INFO for standard operational logging (recommended for production) or DEBUG for detailed diagnostic information while troubleshooting issues.
Note
Not configuring optional settings will simply disable the associated feature.
Visual Graph Explorer Interface
Landing Page
The landing page displays a list of all available graphs exposed through the selected graph database folders and, when configured, the selected unmanaged Neo4j databases.
For graphs published from the Editor, metadata such as the last build time is shown to indicate data freshness.
Graph Exploration Page
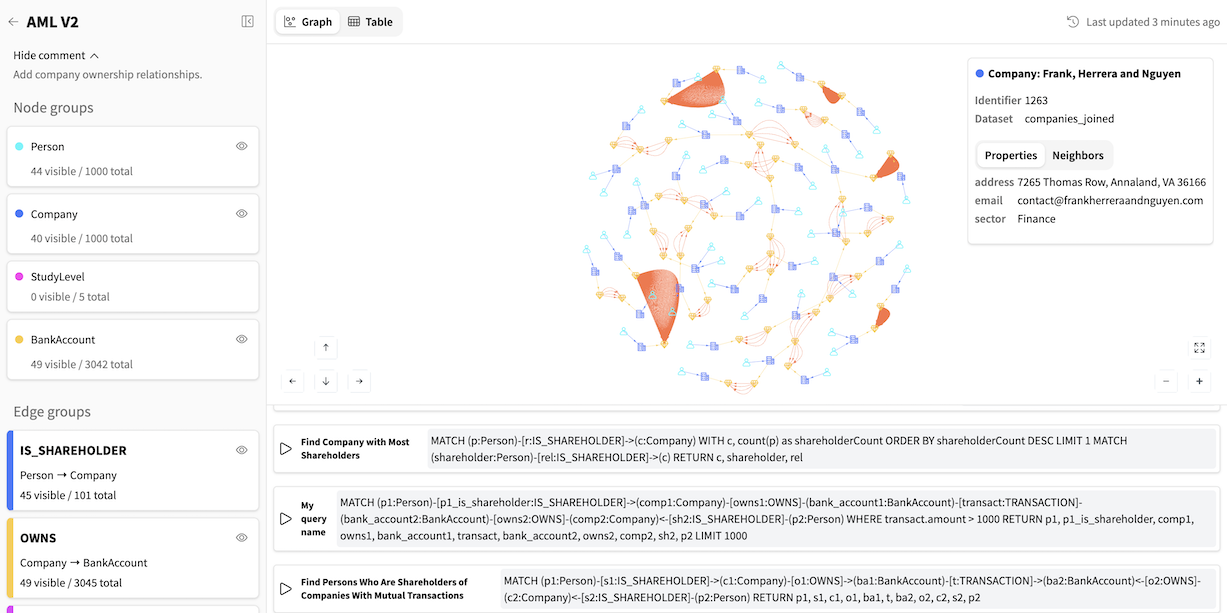
Left-side panel
Graph information
The top of the panel displays the graph’s name.
For graphs published from the Editor, it also displays the last build time and any comment saved with the published configuration.
Groups
All node and edge groups are listed with their respective colors.
Graph statistics
For each group, two types of counts are shown:
visible: The number of nodes/edges currently displayed.
total: The total number of nodes/edges for that group in the entire graph database.
View controls
For each node and edge group, you can toggle its visibility on or off to show or hide all elements of that group in the current view.
Bottom panel
Saved queries tab
The Saved queries tab contains any pre-built queries saved with the published graph configuration. They can be executed to see the results rendered as a graph or a table.
Note
These queries are prepared by data scientists in the Editor webapp.
For unmanaged Neo4j databases exposed directly in the Explorer, this tab is typically empty because no Visual Graph saved queries are attached to that database.
New query tab
The New query tab provides a powerful editor with schema-aware autocompletion to write and execute your own Cypher queries.
Query generator tab
For complex queries, the Query generator tab allows you to ask a question in natural language. The AI assistant will translate your question into a Cypher query that you can then execute.
Central panel
In the Graph view, you can click on any node or edge to inspect its details, including its identifier, name, and properties.
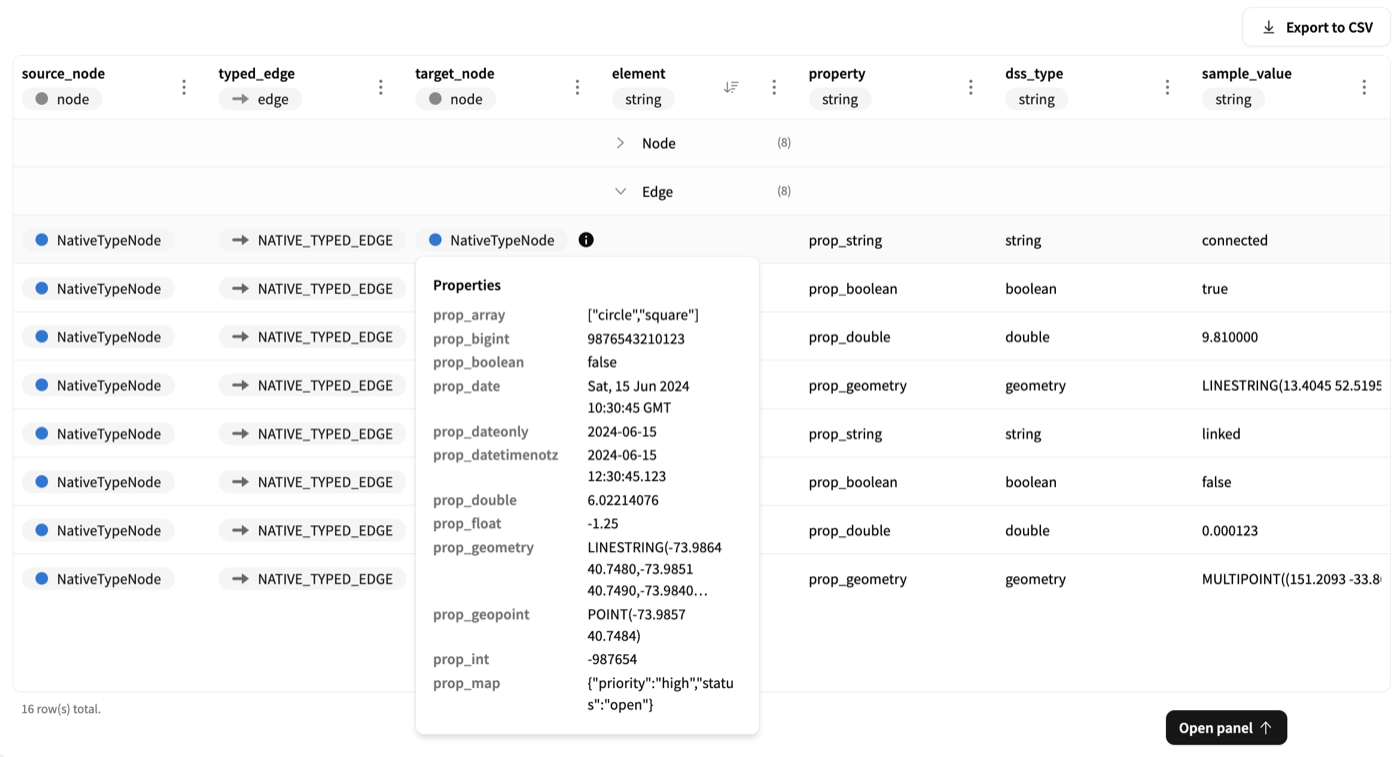
In the Table view, query results are rendered as typed cells. See Query table results for supported table value types.
Create an insight
Click Create insight to capture the current query result and view as a static project insight, which you can then add to a dashboard. This action is only available to users with permission to write dashboards in the project.
When a node is selected, an additional Neighbors tab is available. It provides an overview of all directly connected nodes, displaying the total neighbor count and a breakdown by node group.
From here, you can selectively expand all neighbors or only those belonging to a specific group to explore the graph’s structure interactively.
Edge merging
To keep dense multigraph results readable, Visual Graph can merge parallel edges between the same source node, target node, and edge group.
A merged edge shows how many individual edges it represents. Edge merging is enabled by default for groups of at least 10 parallel edges.
You can change the threshold, disable merging, expand a merged edge back to its individual edges, or browse the individual edges from the selected-edge details.
Graph layouts
Switch between different layouts to optimize the visualization of your graph based on its structure.
Options include gravity (the default layout), tree for hierarchical data and circle or square grid grouping to cluster nodes per group.
Warning
Tree layout is computationally intensive. It is not recommended for large graphs.
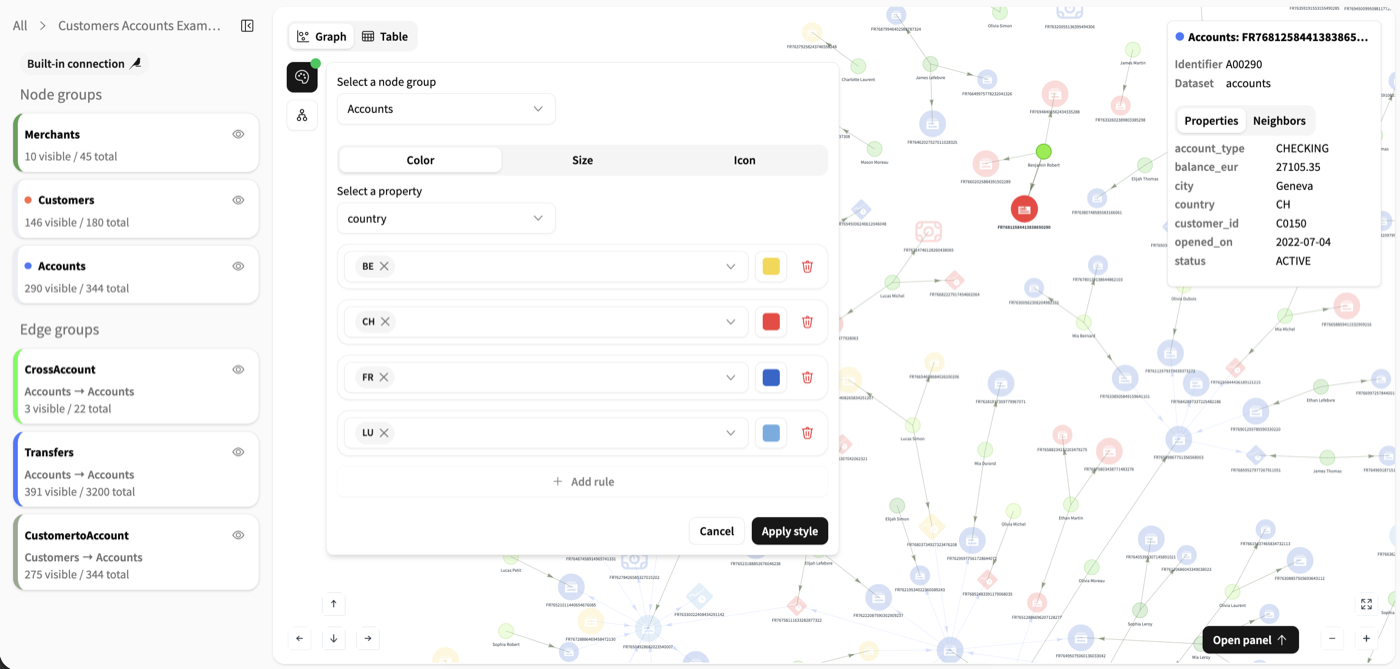
Conditional styling
Enhance the visual analysis of your graph by styling nodes based on the values of a selected property.
You can define color, size, or icon rules per node group. For numerical values, you can work with ranges and gradients. For categorical values, you can assign styles to specific values.
You can also define Focus rules to highlight nodes matching a condition and their incident edges.
It helps identify patterns, clusters, or outliers within the graph based on specific attributes.
Note
Conditional styling is a view-level aid for exploration. It does not change the underlying graph configuration, and it is only available for node groups that currently have displayed nodes and available properties.