
Visual Graph Editor
Overview
Visual Graph Editor is a Dataiku webapp designed to streamline the workflow for data scientists working with graph data.
It facilitates the rapid exploration of data relationships and the iterative development of graph schemas to address specific analytical requirements.
Note
We recommend that you get started by following this tutorial.
Key features
- Schema managementCreate and manage node and edge groups.
- Visual explorationVisualize graphs with different layouts, merge parallel edges to simplify dense views, expand neighbors to explore relationships, and apply conditional styling based on node properties.
- Interactive queryingWrite and execute Cypher queries with results rendered dynamically as a graph or in a rich table.
- Query generatorGenerate complex queries using an LLM-powered assistant.
- Saved queriesSave and manage frequently used Cypher queries for reuse.
- Data samplingAdjust the sampling of the source datasets to manage data volume during schema design and testing.
- Connection switchingTest and switch between different graph database technology seamlessly.
- Save configurationSave graph configurations at key milestones.
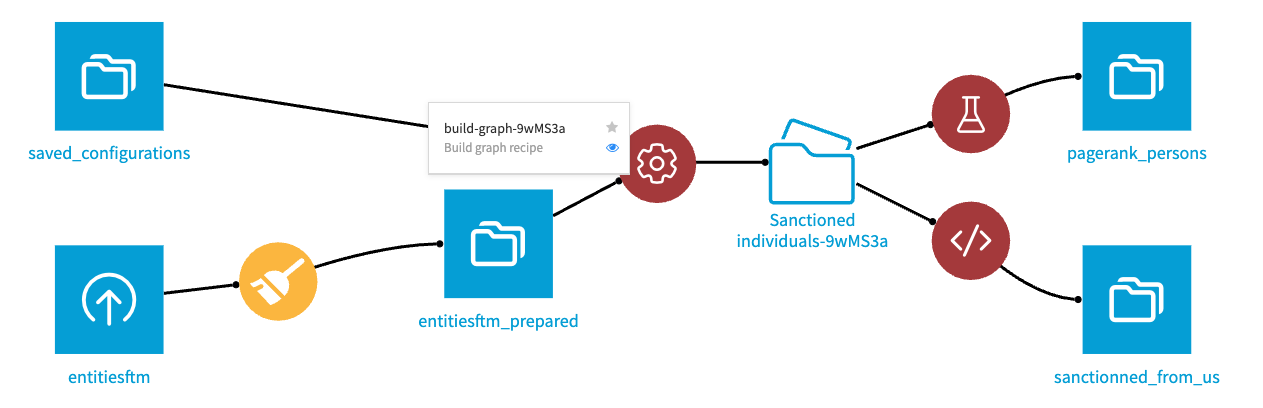
- Publish saved configurationPublish saved configurations to the project Flow to be used by other components of the plugin.
Technical considerations
- Multi-directed property graphVisual Graph is designed to efficiently handle multi-directed property graphs, a versatile graph model where edges can have multiple directions between the same pair of nodes and carry detailed properties.This flexibility allows for richer data representation, making it ideal for use cases such as social networks, knowledge graphs, and complex relational data.Each node and edge in the graph can store key-value properties, enabling expressive queries and advanced analytics.For a deeper understanding of property graphs, refer to the Property Graph Model, and for more on directed multigraphs, see Multigraphs and Directed Graphs.
- Data type inferenceVisual Graph automatically assigns data types to node and edge properties based on the data types of the corresponding columns in the tabular dataset.This ensures consistency between the source data and the resulting graph structure.
Note
Ensuring the correct data types is crucial for predictable behavior in analytical operations such as aggregations. Proper type inference guarantees that numerical operations like summation, averaging, and sorting function correctly.
object |
STRING |
STRING |
string |
STRING |
STRING |
boolean |
BOOLEAN |
BOOLEAN |
date |
TIMESTAMP |
DATE |
tinyint |
INT8 |
INTEGER |
smallint |
INT16 |
INTEGER |
int |
INT32 |
INTEGER |
bigint |
INT64 |
INTEGER |
float |
FLOAT |
FLOAT |
double |
DOUBLE |
FLOAT |
- ScalabilityThe built-in graph database is currently powered by Kuzu.It should help you scale to hundreds of millions of nodes with the appropriate RAM resources. Beyond this threshold or if you have extensive graph algorithms workloads, we recommend using Neo4j and leveraging its infrastructure and technology.
- Multi-user supportAll users with access to the webapp can see all the configured graphs and saved queries, including the ones created by other users. They can also freely update the configuration and saved queries. This will impact all the other users.The only aspect that is not shared between users is the graph and table views. Users can explore and execute their queries and see the results independently from each other.In case of concurrent update to the graph configuration, the users will be warned and we will prevent further update to the configuration to prevent loss of work.
Settings
Note
Not configuring optional settings will simply disable the associated feature.
- Node/Edge sources
Source Datasets for Nodes & Edges (Optional): select one or multiple datasets that contain the source data for nodes and edges. The same dataset can be used for both nodes and edges. If no datasets are selected, all the datasets of the current project will be available as sources when defining node and edge groups.
- Neo4j connection
Neo4j server configuration (Optional): select a writable Neo4j connection to make it available in the Editor to test your graph configurations against Neo4j.
- AI assistant
LLM connection (Optional): select a LLM connection to enable the AI-powered Query generator. It helps users construct complex Cypher queries using natural language.
LLM history dataset (Optional): select the dataset storing the history of all questions asked by users in the Query generator. It can be used for auditing or analysis.
- Graph publication
Saved configuration dataset (Optional): select or create the dataset that will contain your saved configurations. It is used as the source of saved configurations that can be published.
Connection for publishing graphs (Optional): select the connection where the published graph databases will be stored. This connection is used by the Editor to automatically create a Dataiku Folder containing the published graphs.
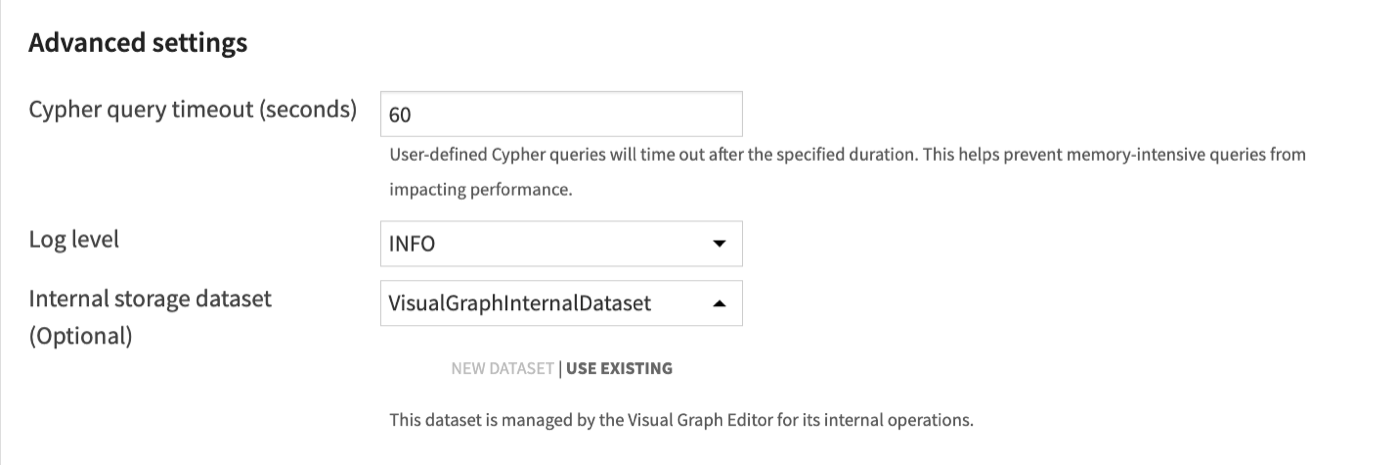
- Advanced settings
Cypher query timeout (seconds): set a maximum execution time for queries run within the Editor. This acts as a guardrail to prevent resource-intensive queries from impacting performance.
Log level: configure the verbosity of the logs. Select INFO for standard operational logging (recommended for production) or DEBUG for detailed diagnostic information while troubleshooting issues.
Internal storage dataset (Optional): select or create the dataset persisting the internal state of the webapp. Any type of underlying storage (FileSystem, S3, SQL,…) is supported. If no dataset is selected, the internal state of the webapp will be persisted in the workload folder of the webapp.
Warning
Using the workload folder of a webapp is only supported for webapps running on the Dataiku backend.
If the Editor runs in a container, select or create an Internal storage dataset instead of relying on the workload-folder fallback.
Visual Graph Editor Interface
Landing Page
It lists all the created graphs. You can also create new graphs from there.
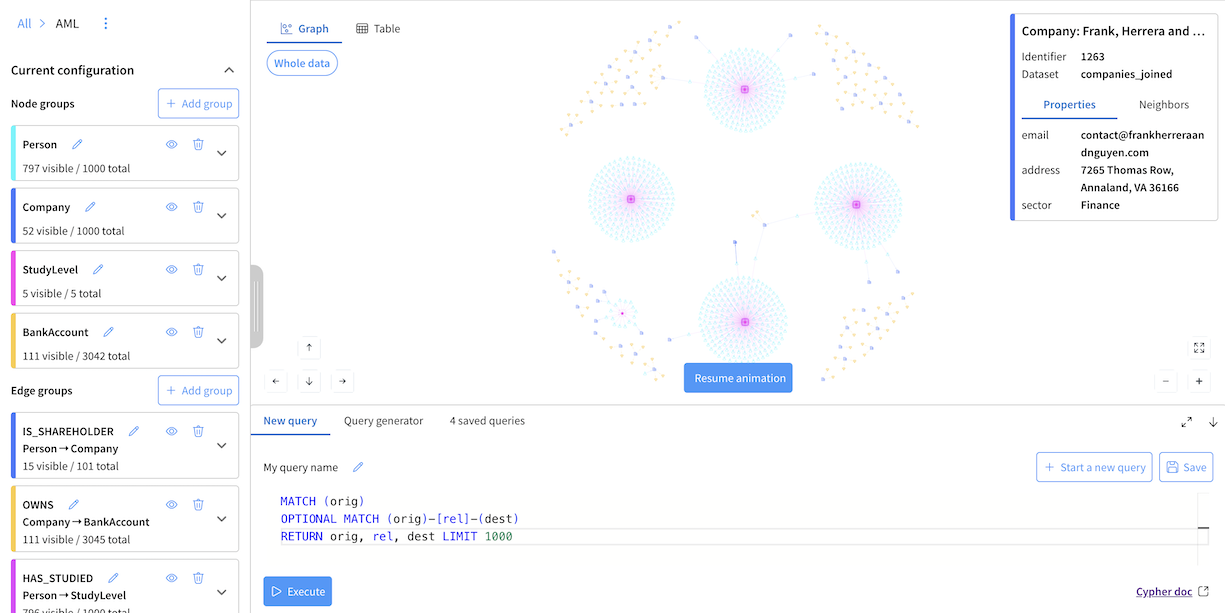
Graph Page
Schema section
The Schema section on the left panel allows you to define the structure of your graph by creating node and edge groups.
Node group definition
Select dataset: Select the dataset containing the nodes information.
Filter data (Optional): If the source dataset contains records for multiple node types, use Filter data to specify the conditions for including a record in this specific group.
Select column with unique identifiers: Select the column that serves as the unique identifier (i.e., primary key) for each node.
Select column with names: Select the column whose values will be used as the display name for the nodes. You can re-use the identifier column if a dedicated name column is not available.
Node properties (Optional): Select any additional columns from the source dataset to be included as properties for each node.
+ Add additional definition (Optional): If the data for a node group is distributed across multiple datasets, click + Add additional definition. This allows you to map another data source to the same node group by repeating the configuration process.
Customize (Optional): Customize the visual representation of nodes within the graph visualization, by setting a color, icon or size.
Edge group definition
Select source node group: Select the source (origin) node group for the edge.
Select target node group: Select the target (destination) node group for the edge.
Note
A node group can be both the source and target, which is useful for defining edges between nodes of the same type.
Select dataset: Select the dataset containing the edges information.
Filter data (Optional): If the source dataset contains records for multiple edge types, use Filter data button to specify the conditions for including a record in this specific group.
Select column with source identifiers: Select the column containing the unique identifiers (i.e., primary key) of the source nodes.
Select column with target identifiers: Select the column containing the unique identifiers (i.e., primary key) of the target nodes.
Select additional properties (Optional): Select any additional columns from the source dataset to be included as properties for each edge.
+ Add additional definition (Optional): If the data for an edge group is distributed across multiple datasets, click + Add additional definition. This allows you to map another data source to the same edge group by repeating the configuration process.
Customize (Optional): Customize the visual representation of edges within the graph visualization, by setting a color or size.
Connection & Sampling section
- Connection
Select the graph database to use. It can be either the built-in graph database or a Neo4j connection if you have configured one in the webapp settings.
Data sampling
Note
To manage performance and ensure rapid iteration during schema development, the Editor builds the graph using a sample of your source data by default.
Sampling method
Head: Builds the graph using the first N rows of each source dataset. This is the default setting. Random: Builds the graph using N randomly selected rows from each source dataset.
Sample size
Adjust the number of rows (N) to be included from each dataset. Increasing this value provides a more comprehensive view of your data at the cost of longer processing times.
Disable sampling
Disable sampling entirely to build the graph using the full contents of your source datasets.
Warning
Disabling sampling is not recommended during the iterative design phase. Processing the entire content of source datasets can be time-consuming and may significantly slow down schema exploration and validation, especially with large data volumes.
Saved configurations section
This section allows you to manage different versions of your graph configuration. You can create and publish current configurations whenever you reach a significant milestone in your design process.
Graph exploration
- Interactive graph explorationSelect any node or edge to inspect its details, including its identifier, name, properties and neighbors.The Neighbors tab provides an overview of all directly connected nodes, displaying the total neighbor count and a breakdown by node group.You can also selectively expand all neighbors or only those belonging to a specific group to explore the graph’s structure interactively.
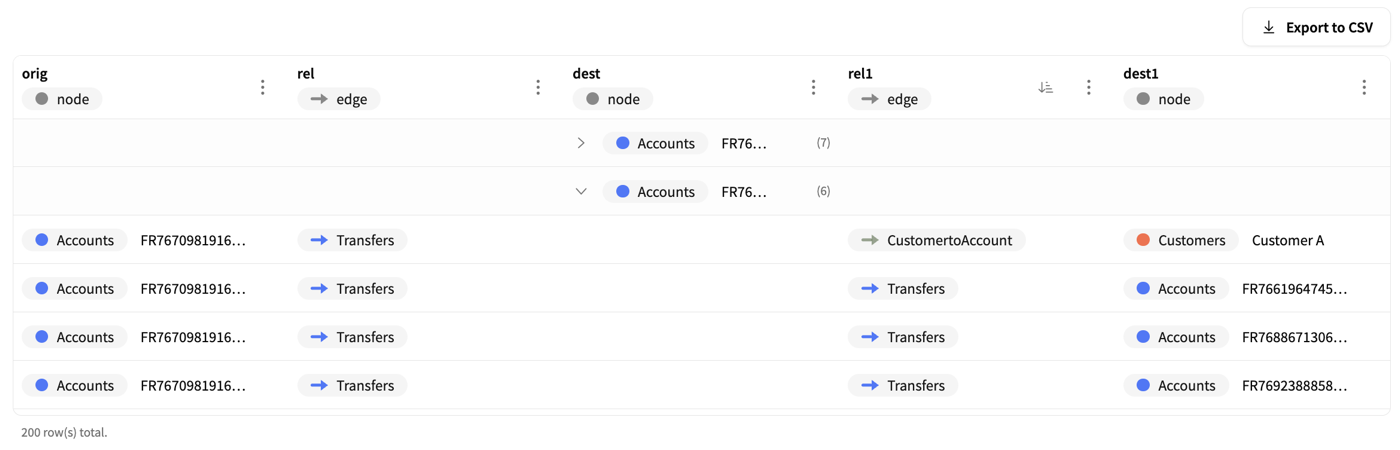
- Edge mergingTo keep dense multigraph results readable, Visual Graph can merge parallel edges between the same source node, target node, and edge group.A merged edge shows how many individual edges it represents. Edge merging is enabled by default for groups of at least 10 parallel edges.You can change the threshold, disable merging, expand a merged edge back to its individual edges, or browse the individual edges from the selected-edge details.
- Graph layoutsSwitch between different layouts to optimize the visualization of your graph based on its structure.Options include gravity (the default layout), tree for hierarchical data and circle or square grid grouping to cluster nodes per group.
Warning
Tree layout is computationally intensive. It is not recommended for large graphs.
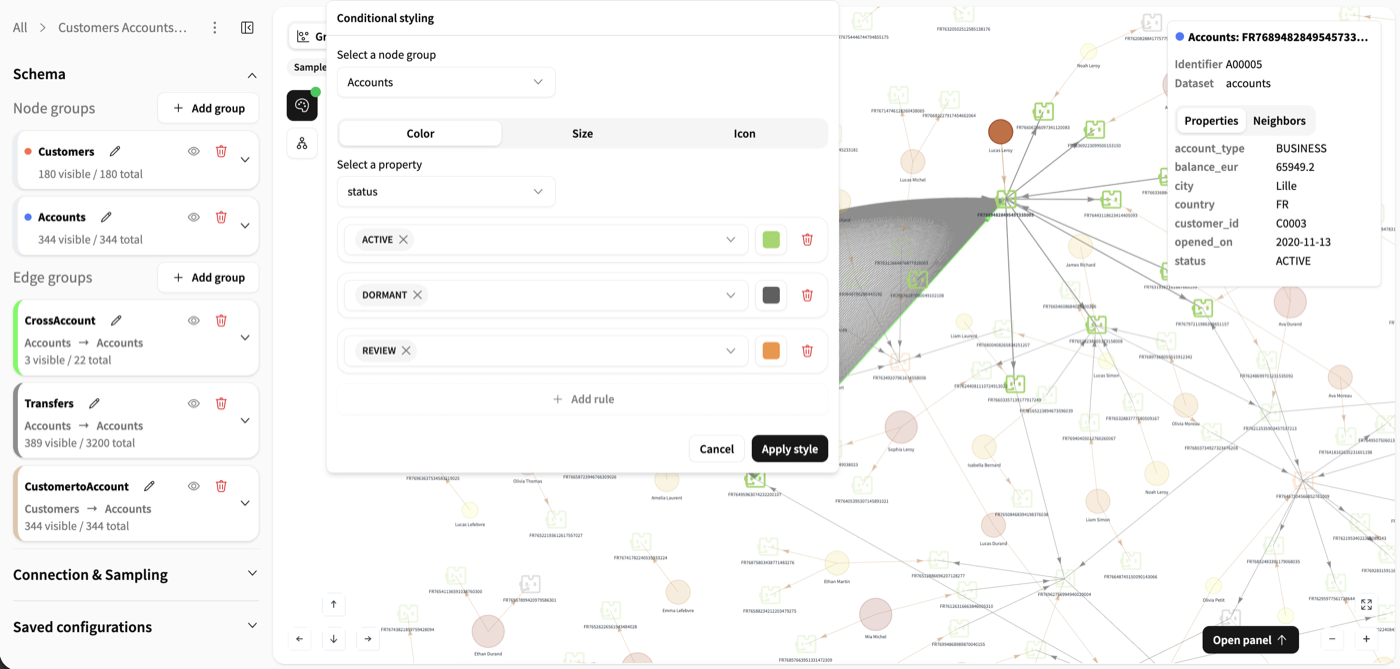
- Conditional stylingEnhance the visual analysis of your graph by styling nodes based on the values of a selected property.You can define color, size, or icon rules per node group.You can also define Focus rules to highlight nodes matching a condition and their incident edges.For numerical values, you can work with ranges and gradients. For categorical values, you can assign styles to specific values.It helps identify patterns, clusters, or outliers within the graph based on specific attributes.
Note
Conditional styling is a view-level aid for exploration. It is not saved into the graph configuration, and it is only available for node groups that currently have displayed nodes and available properties.
- View controls and statisticsThe left panel provides controls for managing the graph visualization.Group visibility: For each node and edge group, you can toggle its visibility on or off to show or hide all elements of that group in the current view.Graph statistics: Key metrics are also displayed.View count: Shows the total number of nodes and edges per group currently displayed as a result of the last executed query.Total count: Shows the total number of nodes and edges in the underlying graph database, based on your sampling configuration.
Note
The Editor stores the current conditional styling, layout, group visibility, edge-merging settings, and last selected saved query in browser storage for each graph. These view settings are restored when you reopen the graph, but are not part of the shared graph configuration.
- Cypher query executionThe bottom panel contains a Cypher query editor with smart autocompletion that adapts to your defined schema.Executing a query returns results in either a visual graph or a table format.See Query table results for supported table value types.Aggregation query results are available in the table format.
 Any query you find useful can be saved to the Saved queries tab for reuse or sharing with team members.
 - Query generatorThe Query generator tab allows you to ask a question in natural language.It will generate a corresponding Cypher query designed to answer your question. You can then save the generated query or ask another question.
- Saved queriesSave and manage frequently used Cypher queries for reuse.
Note
Saved Cypher queries are tied to the current graph schema and graph database technology. If you change the database technology or materially change the graph schema, review the saved queries and rewrite them when needed.
Next topics
For business users: Configure an Explorer webapp using this graph for interactive exploration and discovery.
For data scientists: Run graph algorithms and perform feature engineering at scale using the Execute Cypher, Graph features, and Graph clustering recipes.
For AI applications: Utilize the graph as a dynamic knowledge source for Retrieval-Augmented Generation (RAG) with the Graph Search Agent Tool.