Dashboard concepts
Dashboards, tiles and insights
There are three kinds of tiles:
Simple tiles:
Text tile: to add some text and titles to your dashboard.
Image tile: to add images to your dashboard.
Embedded page: to add a web page to your dashboard.
Group tile: to group tiles together. See Group tile for more information.
Insight tiles. Each of these tiles displays a single insight. See Insights for more information.
Filters panel: tile. See Filters for more information.
Group tile
A group tile is a container used to organize multiple tiles together. It helps visually and functionally group related content, and offers customization options for layout and styling.
It allows you to:
Frame several tiles inside a customizable container
Personalize the group’s background color and opacity
Control the spacing between tiles within the group
Creation
To create a group tile, switch your dashboard to edit mode, then use one of the following methods:
From the “+ NEW TILE” modal: select Group tile
By grouping existing tiles:
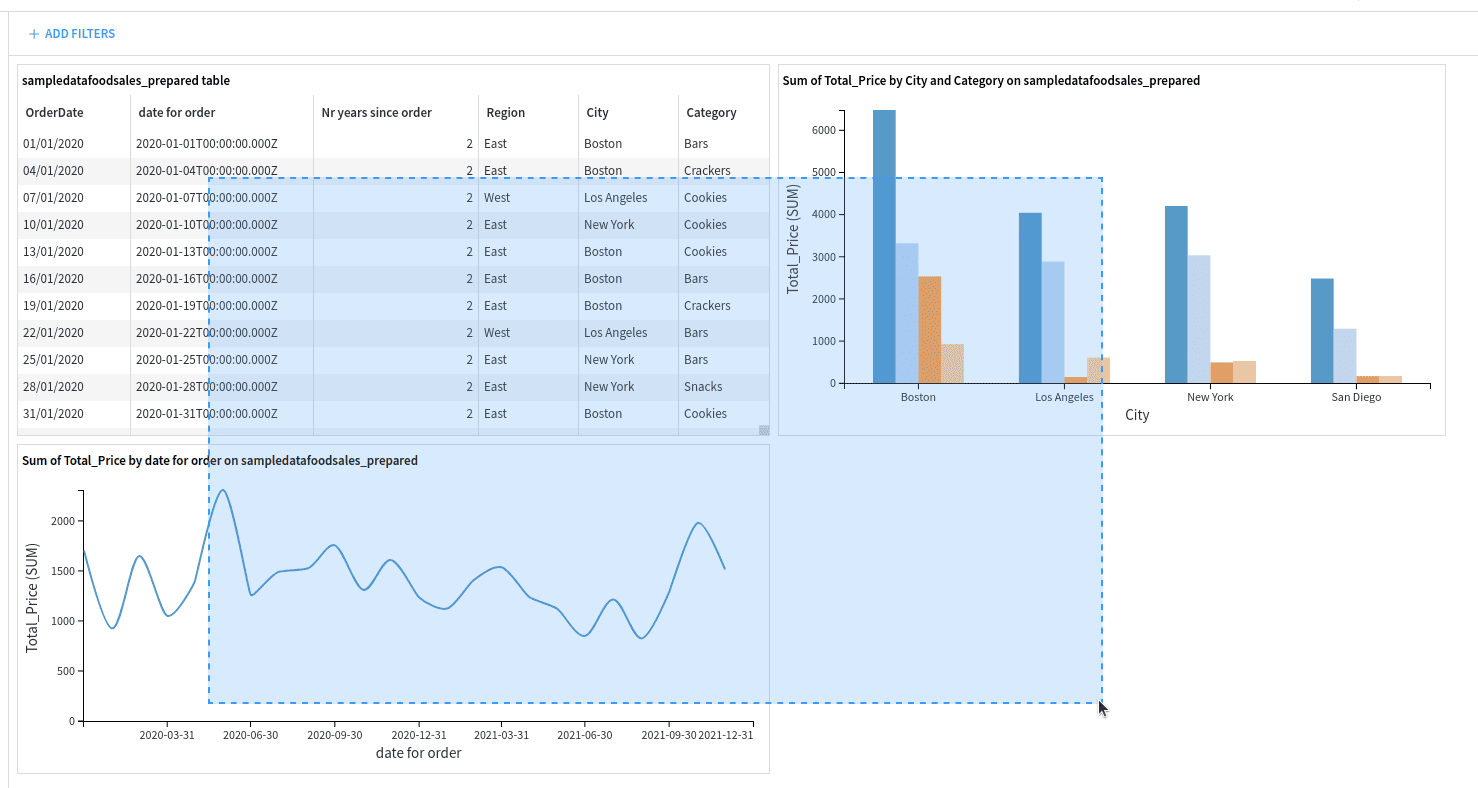
Select multiple tiles: you can select multiple tiles using either method:
Click selection: Hold
ctrl(Linux/Windows) orcmd(macOS) and click each tile you want to includeRectangle selection: Hold the
Shiftkey and click and drag with the left mouse button to draw a rectangle. Any tile touched by the rectangle will be selected.

Click the “Group tiles” button displayed on the left panel or use the shortcut:
ctrl+alt+Gon Linux and Windowscmd+option+Gon macOS
Any unselected tile that overlaps with the newly created group tile will be pushed to the bottom of the dashboard.
Editing
A group tile can be edited, rearranged and styled:
Rearrange tiles: Select the group tile, then drag and resize the tiles inside the group as needed
Add tiles: Drag and drop additional tiles from the main dashboard grid into the group tile
Remove tiles: Select the group tile, then drag a tile out of the group, into the main dashboard grid
Customize:
Change the background color and opacity in the group tile’s settings panel
Adjust the spacing between inner tiles in the settings panel:
Choose to inherit the dashboard’s default tile spacing
Or define a custom spacing value (in pixels)
Deletion
You have two options to delete a group tile:
Delete the entire group and its content: Click the trash icon in the group tile’s header.
Ungroup tiles: You can ungroup tiles to remove the container and return all inner tiles to the main dashboard grid.
Click the Ungroup icon in the group tile’s header.
Select the group tile, then use the shortcut:
ctrl+alt+Gon Linux and Windowscmd+option+Gon macOS
Insights
An insight is a piece of information that can be shared on a dashboard. There are many kinds of insights:
Activity & comments feed of any DSS object
Activity summary reports of a DSS project
A button to run a DSS macro
Each insight lives independently from dashboards and can be attached on multiple dashboards. By default, DSS always creates new insights when adding something to the dashboard, but you can also choose to reattach an existing insight.
Most insights reference DSS objects:
A dataset table references a dataset
A chart references a dataset
A machine learning model report references the machine learning model
A DSS metric insights references a dataset, model or folder
Security is owned by the referenced objects, through the Authorized objects mechanism. In other words, if a dataset added as an authorized object with the READ mode, it is considered as ‘dashboard-authorized’, and the dashboard-only users of the project will be able to create dataset tables, charts and comment insights based on this dataset.
Insights live independently from their referenced objects. In most cases, modifying anything on the insight will either be impossible, or will not reflect in the original object.
When you are on the dashboard, you can go to a full-size view of the insight by clicking on the Go button

Permissions
Owners
Each dashboard (and each insight) has an owner, who is the person who created this dashboard (resp insight).
The following people (apart from the owner) can modify a dashboard created by a given user:
People who have “Write Dashboard” access to the project (See Main project permissions)
DSS administrators
Dashboard visibility
Everybody who has “Read dashboards” permission to the project can view a dashboard, regardless of who created it: dashboards don’t carry access restrictions. However, by default, dashboards are unpromoted. An unpromoted dashboard is readable but not visible to users with “Read dashboards”.
To view an unpromoted dashboard, you need to know its URL. This makes it easy to share dashboards with colleagues by sending them the URL. People who have “Write dashboards” permission on the project can see and edit all dashboards in the list (even unpromoted ones of which they are not the owner). They can also promote a dashboard and make it visible to “Read dashboards” users.
Editing the dashboard as an analyst
When you have “Read project content” on the project, you may add every item to the dashboard, not only items which are previously dashboard-authorized.
Each time you add an item to the dashboard (either directly from the item, or from the dashboard), if this object is not already in the dashboard authorizations, you will get a warning that dashboard-only users will not be able to see this insight, since the source is not dashboard-authorized.
If you have “Manage authorized objects” permission, you’ll get a prompt to add it automatically
If you don’t have “Manage authorized objects” permission, you’ll only have a warning indicating that you must ask your project administrator