
Fit curves and distributions
The Fit curves & distributions cards model the distributions or relationships of numerical variables. To create a card, you must select from the following options:
Fit Distribution
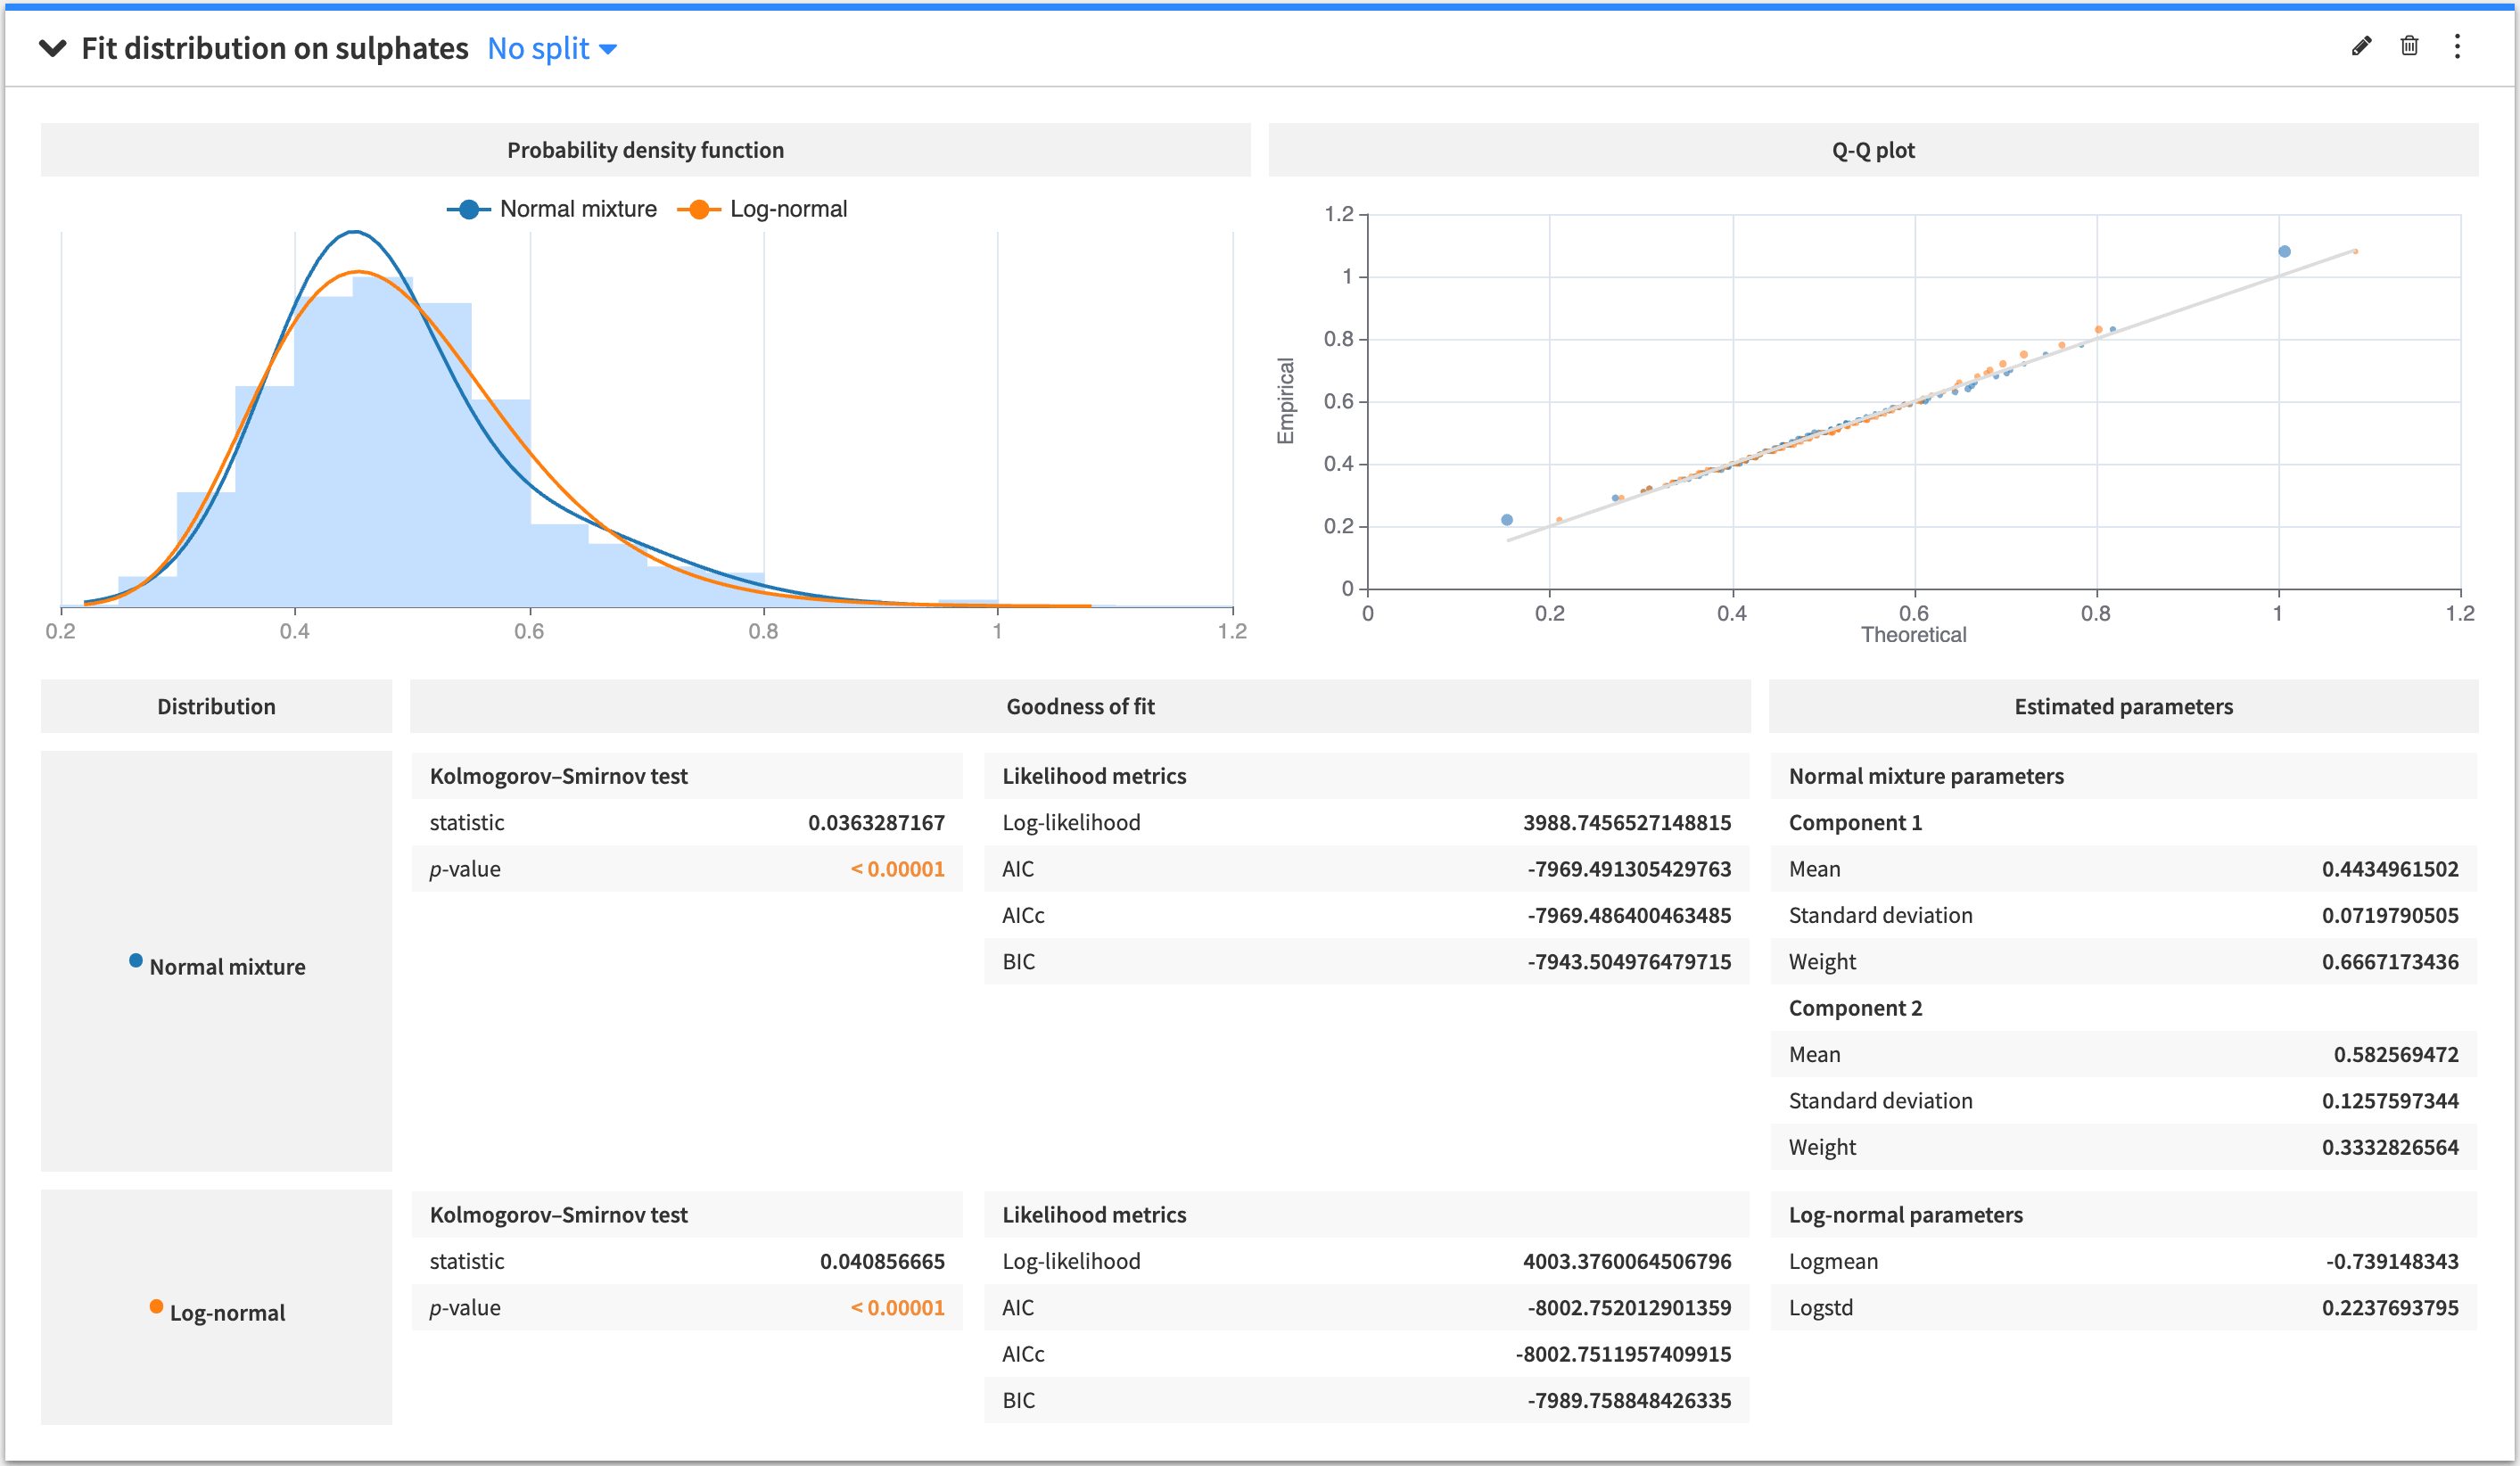
The Fit Distribution card estimates the parameters of probability distributions for a specified variable in your dataset. The supported distributions are:
Beta
Exponential
Laplace
Log-normal
Normal
Normal mixture
Pareto
Triangular
Weibull
You can select multiple distributions in the card, and Dataiku DSS displays the probability density function, Q-Q plot, goodness of fit metrics, and estimated parameters for each distribution.
2D Fit Distribution
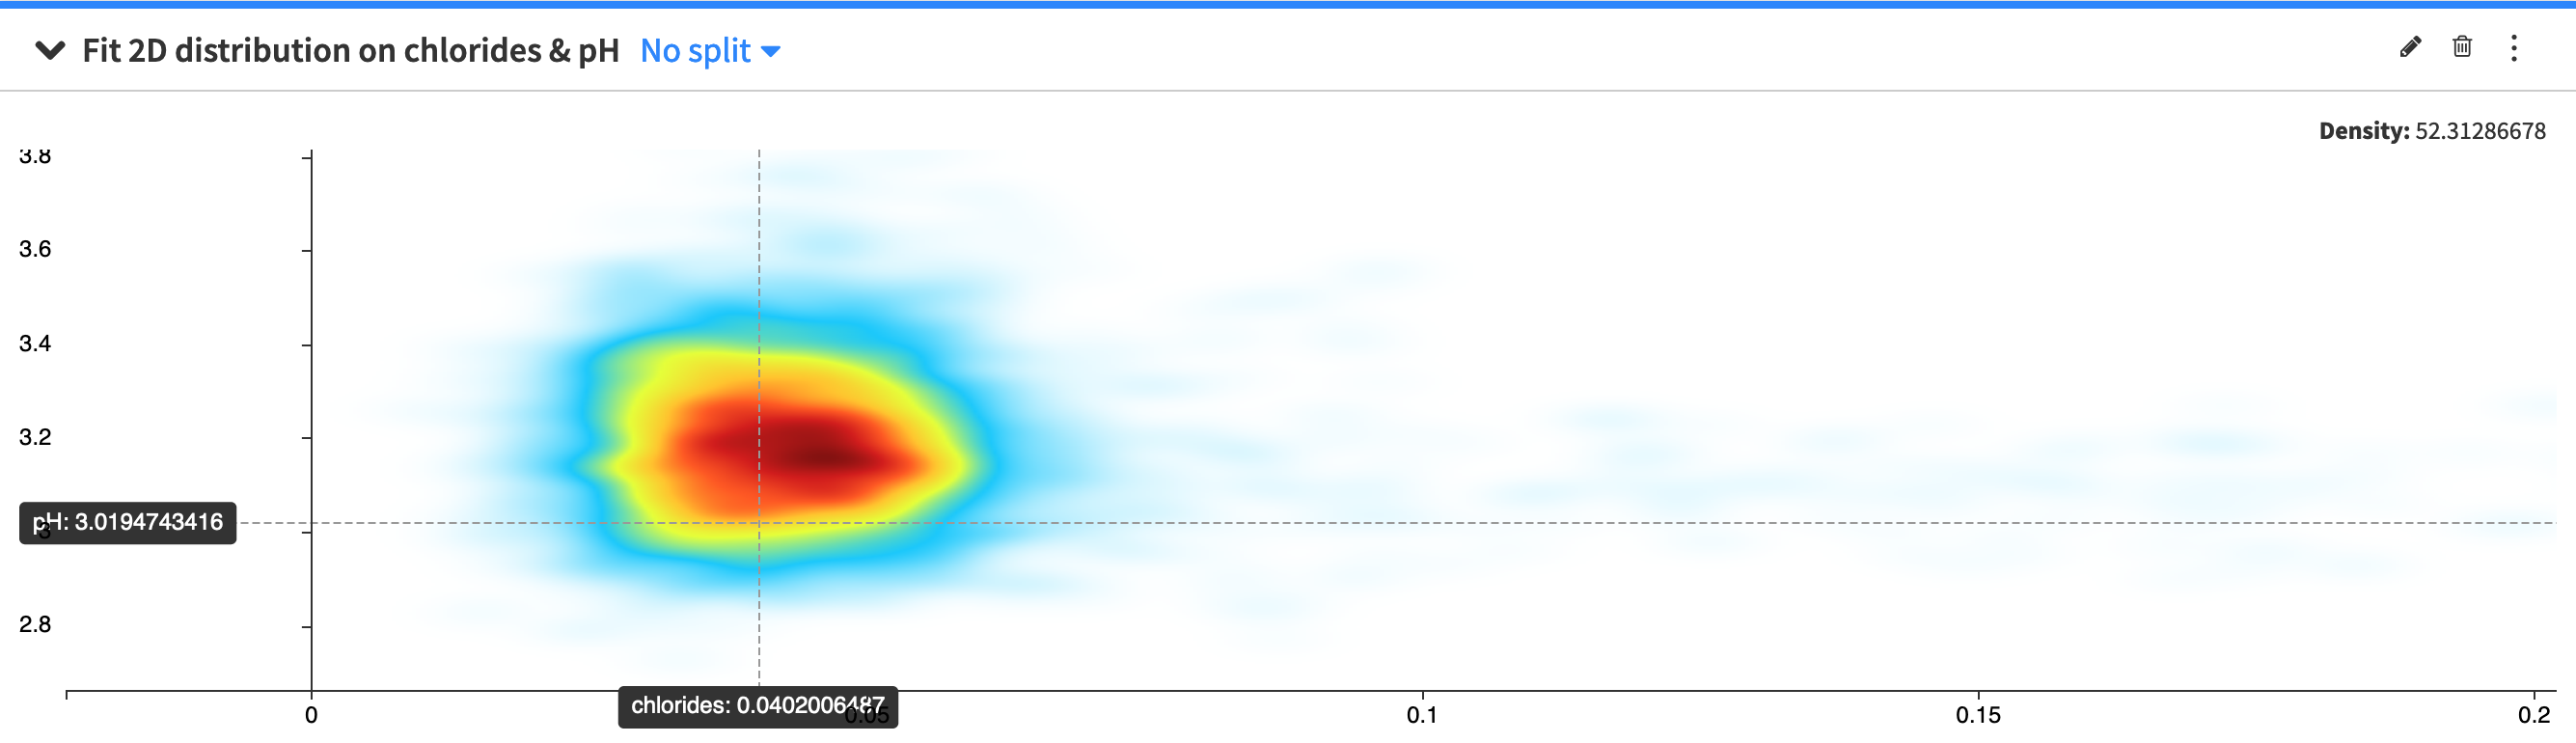
The 2D Fit Distribution card visualizes the density of bivariate distributions by plotting the kernel density estimate (KDE) or the joint normal (Gaussian) distribution. To create the card:
Specify values for the X and Y variables
Select either “2D KDE” plot or the “Joint Normal” plot
If you select the “2D KDE” plot, DSS provides two additional parameters: “X relative bandwidth” and “Y relative bandwidth” (in percentages) with default values. However, you can modify these values to control the smoothness of the KDE plot. Larger values produce smoother plots.
Note that the “X relative bandwidth” value scales the horizontal KDE bandwidth as a percentage of the standard deviation of variable X. Likewise, the “Y relative bandwidth” scales the vertical KDE bandwidth as a percentage of the standard deviation of variable Y.
Fit curve
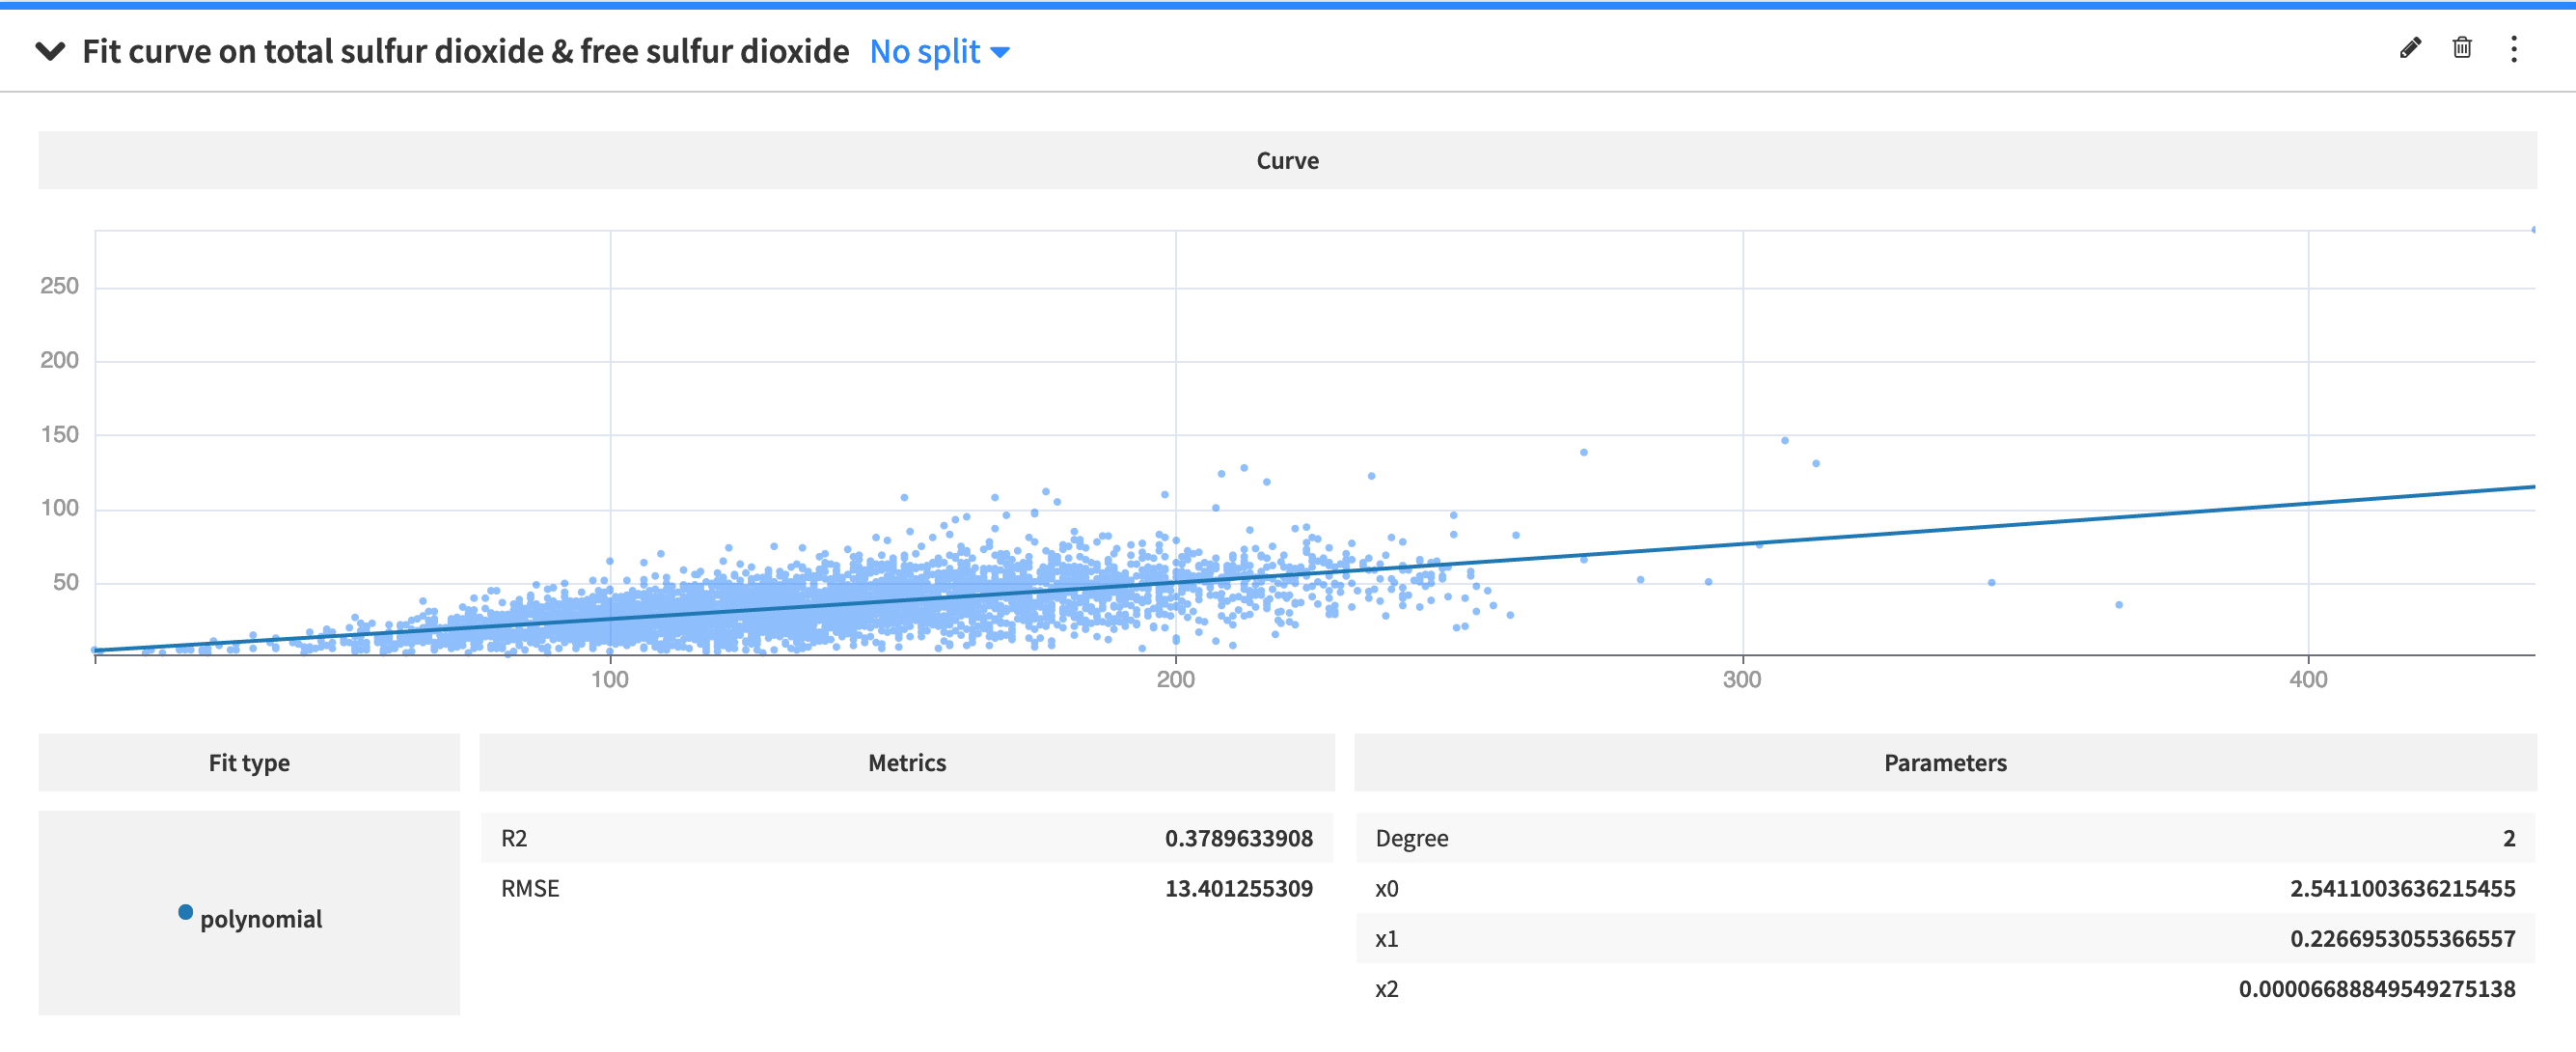
The Fit Curve card models the relationship between two variables by creating one or more fit curves. To create the card:
Specify values for the X and Y variables
Specify the “Curve Type” as Polynomial or Isotonic
If you select a Polynomial curve, then you must provide an integer value for an additional parameter, “Degree”, which specifies the degree of the polynomial.