
Causal Prediction Results
When a model finishes training, click on the model to see the results.
Feature importance
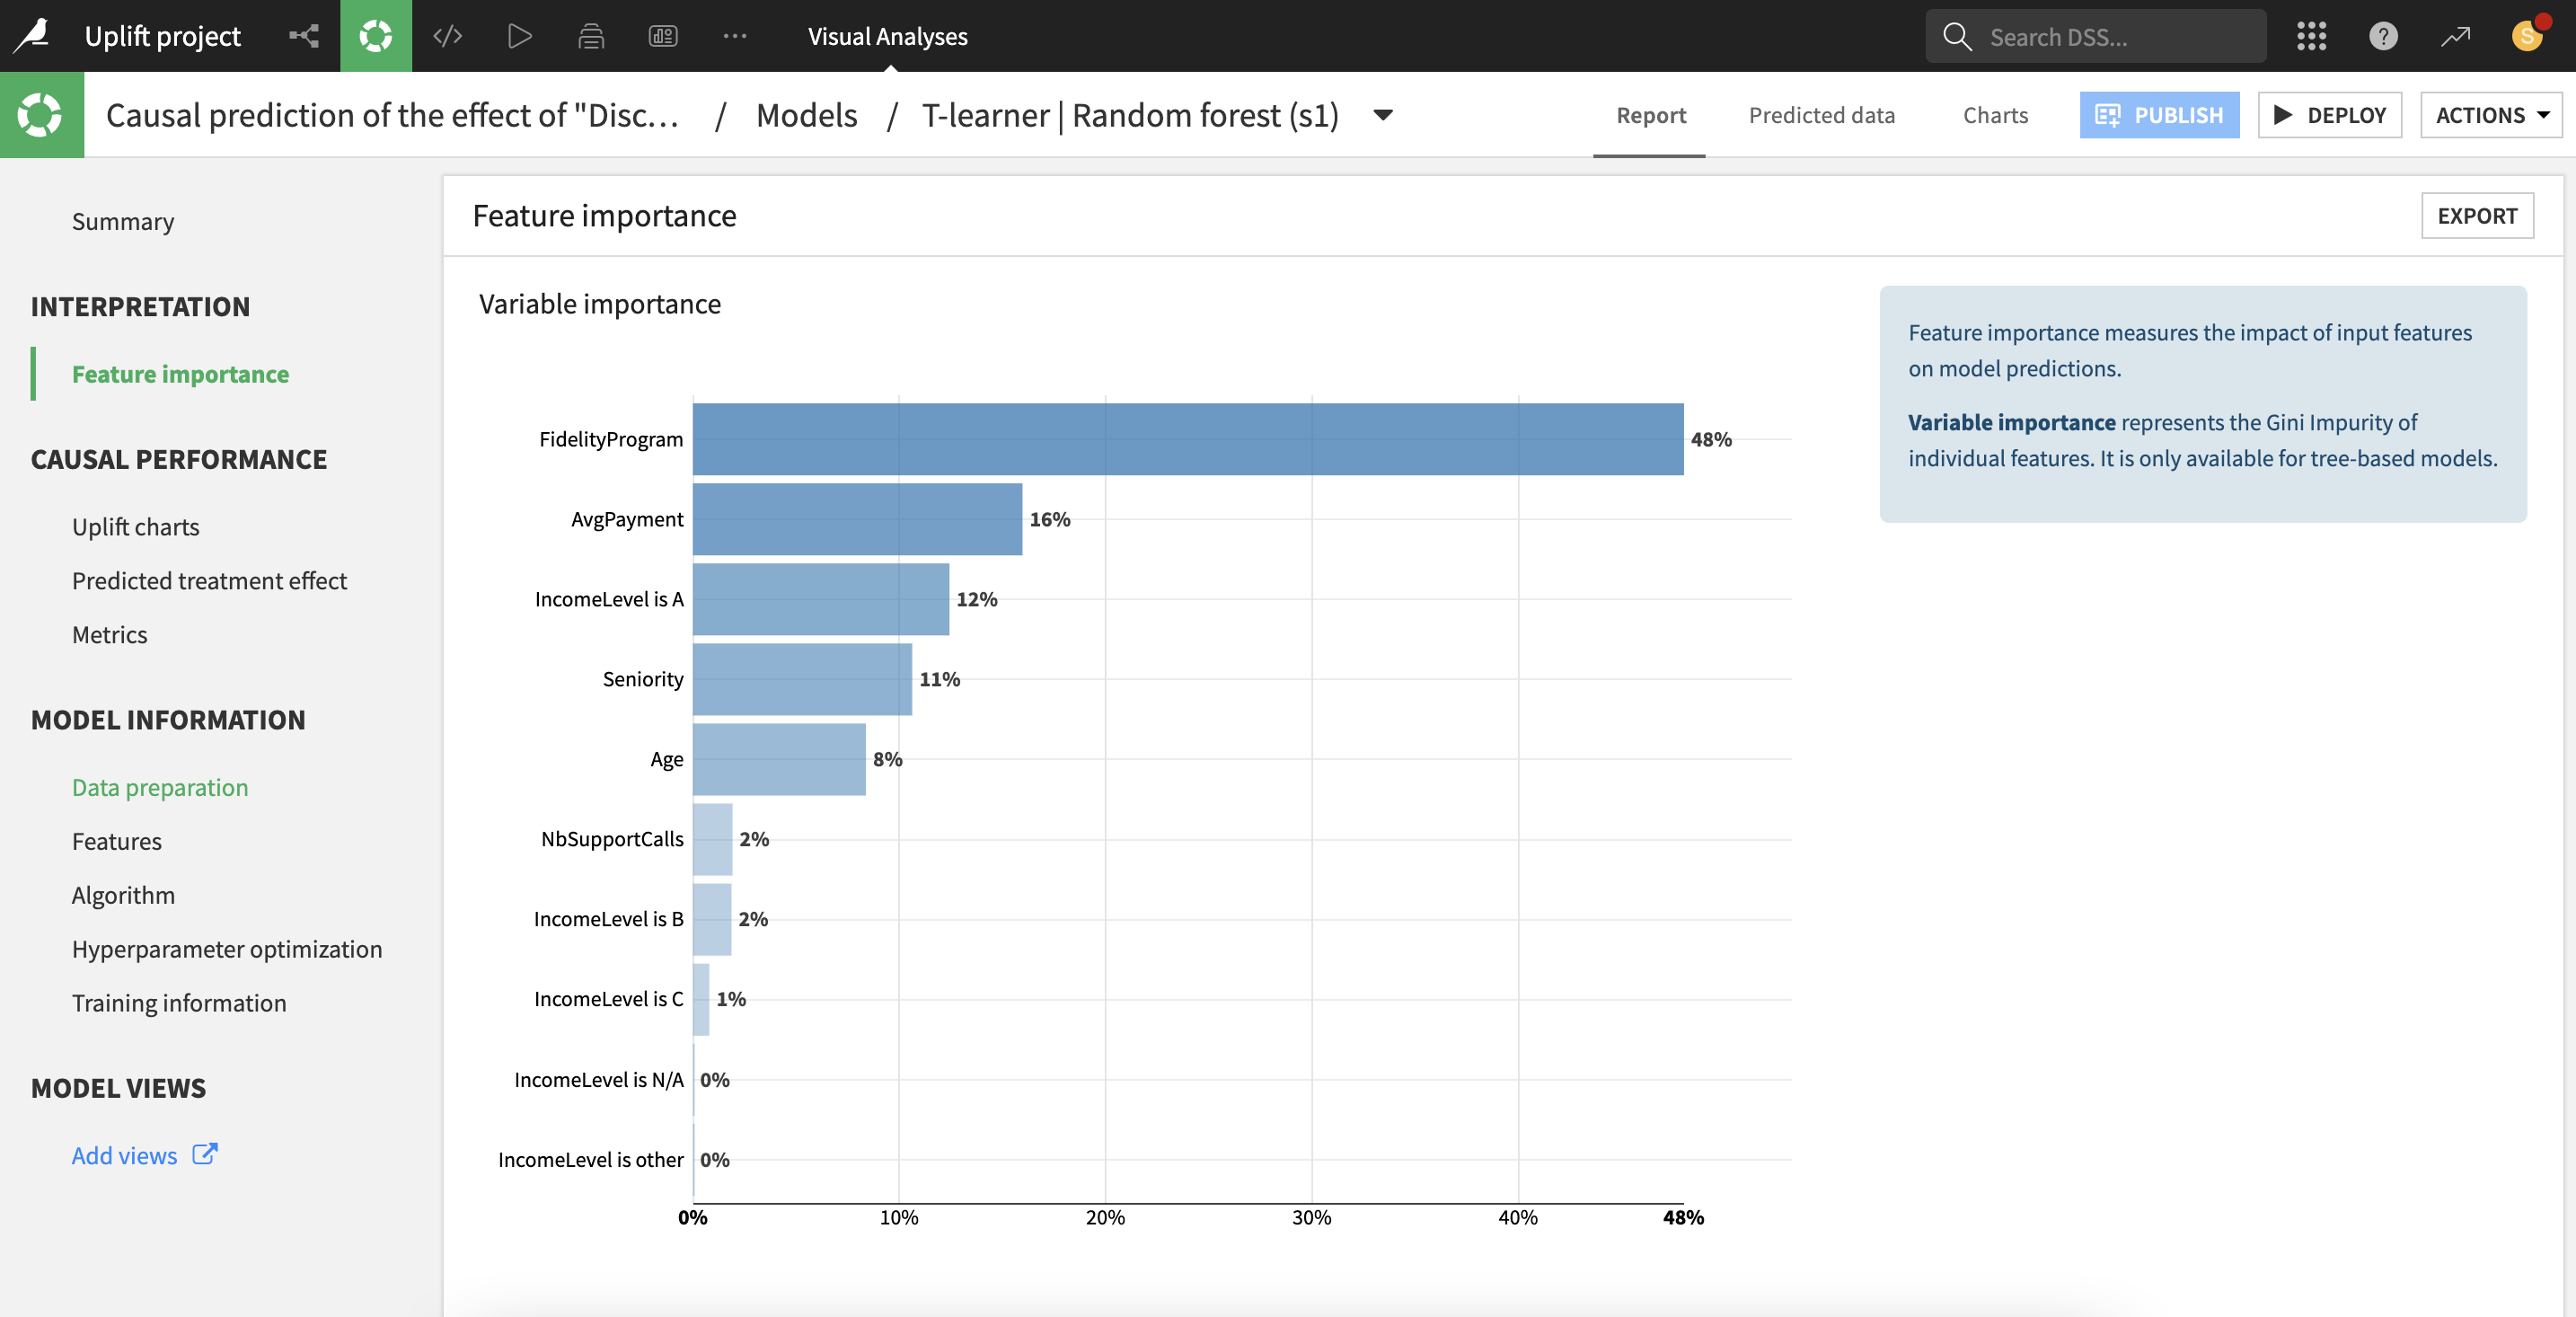
For all causal models with a binary treatment variable, “feature importances” are based on a surrogate tree-based model learning the predicted effects. They are computed as the (normalized) total reduction of the splitting criterion brought by that feature (also called Gini importance).
Importance is an intrinsic measure of how much each feature weighs in the trained model and thus is always positive and always sum up to one, regardless of the accuracy of the model. Importance reflects both how often the feature is selected for splitting, and how much the prediction changes when the feature does. Note that such a definition of feature importance tends to overemphasize numerical features with many different values.
All parameters displayed in these screens are computed from the data collected during the training, so they are entirely based on the train set.
Causal Performance
Dataiku provides insights on the causal model, to help assess how well the model performed at predicting the effects of the treatment on the outcome.
Note
When the multi-valued treatment option is enabled, causal performance is computed for each treatment value t, using the model trained on the relevant subset of the train data, and the relevant subset of the test data. Relevant data refers to treatment values equal to either control or t.
The Overall Metrics table displays metrics that are aggregated across treatments, weighted by the relative size of each treatment group.
Uplift and Qini curves
Causal performance metrics are different from purely predictive performance metrics, because there is no ground truth to which the predicted effect can be compared.
To emulate this counterfactual effect, treatment effects are estimated on subsets of the data by the empirical treatment effect: average outcome of the treated group minus average outcome of the control group (average outcome is meant as frequency of the preferred class for classifications).
More precisely, to compute the uplift curve:
the test observations are sorted by decreasing predicted individual treatment effects (from the causal model).
the treatment effect of each subsets of observations is estimated empirically from the treated and control groups
a normalization is performed so that at the limit of the x-axis (100% of the population treated) the y-axis represents 1 (i.e. the full treatment effect on the total test set).
The formulas for the uplift and Qini curves at ratio x are:
uplift curve:
[Y_treated(tau > tau(x)) - Y_control(tau > tau(x))] * x / N / abs(ATE)Qini curve:
[Y_treated(tau > tau(x)) - Y_control(tau > tau(x))] * N_treated(tau > tau(x)) / N_treated / abs(ATE)
where:
xdenotes a ratio of the test setY_treated(tau > tau(x))(resp.Y_control(tau > tau(x))) denotes the average outcome of individuals in the treated group (resp. control group) with predicted effects in the topxshare of the populationN_treated(tau > tau(x))denotes the number of individuals in the treated group with predicted effects in the top x share of the populationabs(ATE)denotes the absolute value of the Average Treatment Effect, i.e.abs(Y_treated - Y_control)on the whole population.
Distribution of the predicted effect
This histogram approximates the distribution of the predicted effect across the test set. This can provide a picture of:
subpopulations reacting differently to the treatment, e.g. some positively and some negatively
the main range of the predicted effects
existence of extreme cases (outliers).
Treatment Analysis
If the treatment analysis was enabled in the settings, results based on the propensity model will be available.
Note
When the multi-valued treatment option is enabled, treatment analysis is performed for each treatment value t, on the relevant subset of the data, i.e. with treatment values being either control or t (excluding all other treatment values).
Treatment Randomization
If the treatment was randomized across the whole population, the results of causal predictions can more easily be trusted, because all assumptions underlying causal predictions are automatically satisfied. However, even if the data is the result of an experiment where the treatment was perfectly randomly allocated, a number of steps in the data preparation process (data selection, enrichment, feature engineering) can still alter this favorable state. Hence, Dataiku provide a quick test to check if the randomization hypothesis is obviously broken.
The test is built upon the propensity model (model predicting the treatment variable). If this model can actually predict the treatment with a significant accuracy, based on the other covariates, this implies that the treatment was not randomized. Thus, the null hypothesis is that the accuracy of propensity model is below the accuracy of a dummy model always predicting the majority class. A binomial test is performed on the predicted treatments and a p-value is computed for this test. If the p-value is lower than 0.05, the test concludes that the null hypothesis should be rejected with 95% confidence.
Positivity Analysis
In the cases where the treatment was not perfectly randomized, results of causal predictions can still be valid under the positivity hypothesis. This hypothesis states that both treatment values, treated and control, are likely (with non-zero probability), for all relevant combinations of other variables.
Two charts help assess the positivity hypothesis:
a stacked histogram with the distribution of the predicted probability of treatment: violation of the positivity hypothesis can be detected by strongly imbalanced bins e.g. a large number of treated and almost zero control (usually for larger values of predicted probability of treatment)
a calibration curve of the predicted probability of treatment: violation of the positivity hypothesis can be detected by extreme values (very close to 0 or 1) of frequencies of treatment among any bin of predicted probability of treatment.