
Time series visualization
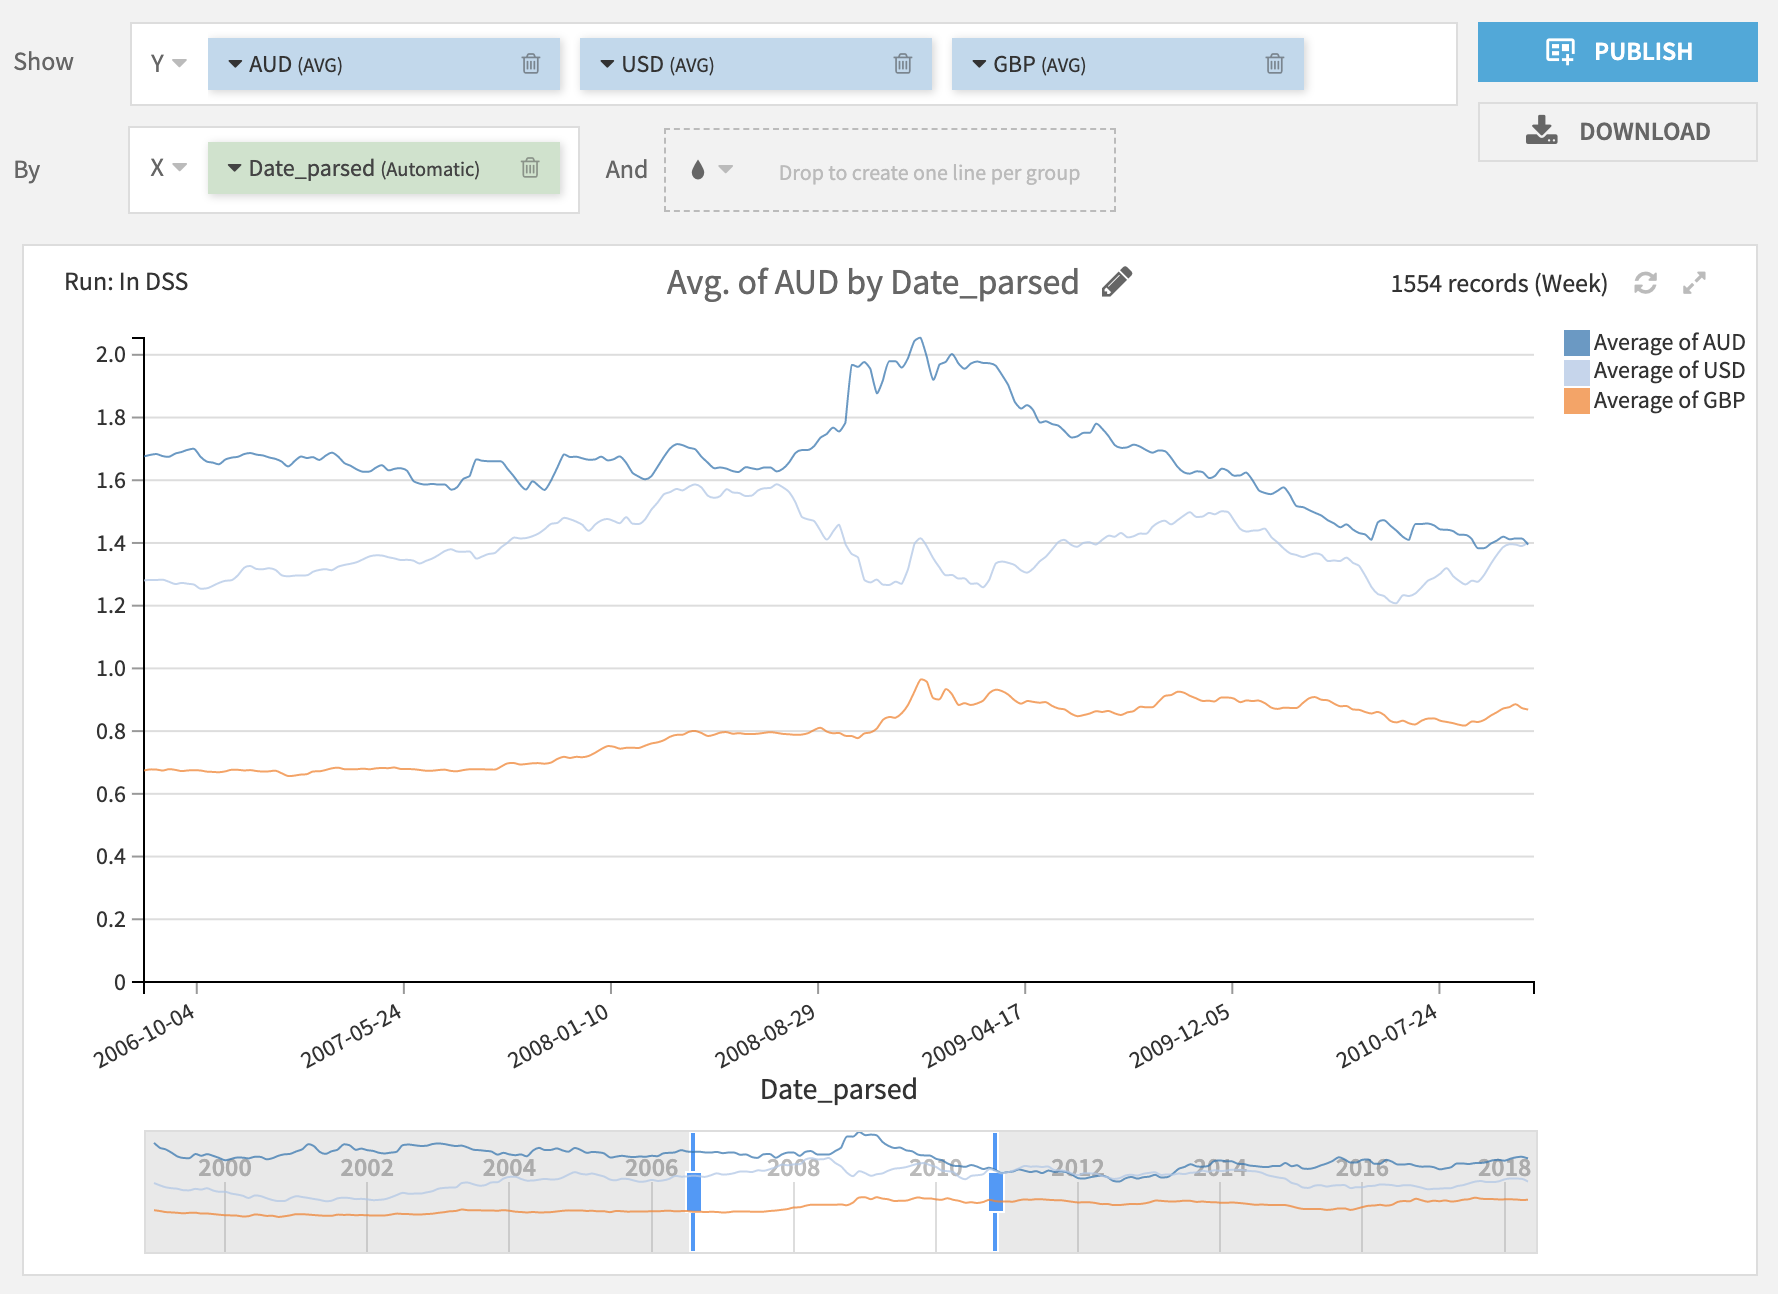
You can visualize time series using line charts with “automatic” aggregation mode.
The automatic aggregation mode allows you to display arbitrarily large series with aggregation pushed down to the database.
Make sure that your timestamp is of the date type to use this chart.
Find more information in Lines & Curves