
Introduction to Dataiku Stories
Note
Note that Dataiku Stories is not available in all Dataiku licenses. You may need to reach out to your Dataiku Account Manager or Customer Success Manager.
Installing Stories
There are several ways to install Dataiku Stories:
If you are using Dataiku Cloud, you need to add Dataiku Stories from the list of Extensions available
If you are using Dataiku Cloud Stacks, you need to refer to the Instance template
If you are using Dataiku Custom, please refer to Install Dataiku DSS
Core features
Dataiku Stories allows you to build contextualized, interactive, and up-to-date data presentations so that you can understand and share the stories hidden in your data. The very first step before creating a Dataiku Story is to create a Workspace and invite the users who will create and read the Stories. In that centralized workspace, Stories can be created using datasets sourced from projects across the company.
The aim of a Dataiku Stories is to be shared and read by a community of users who need to interact with this content.
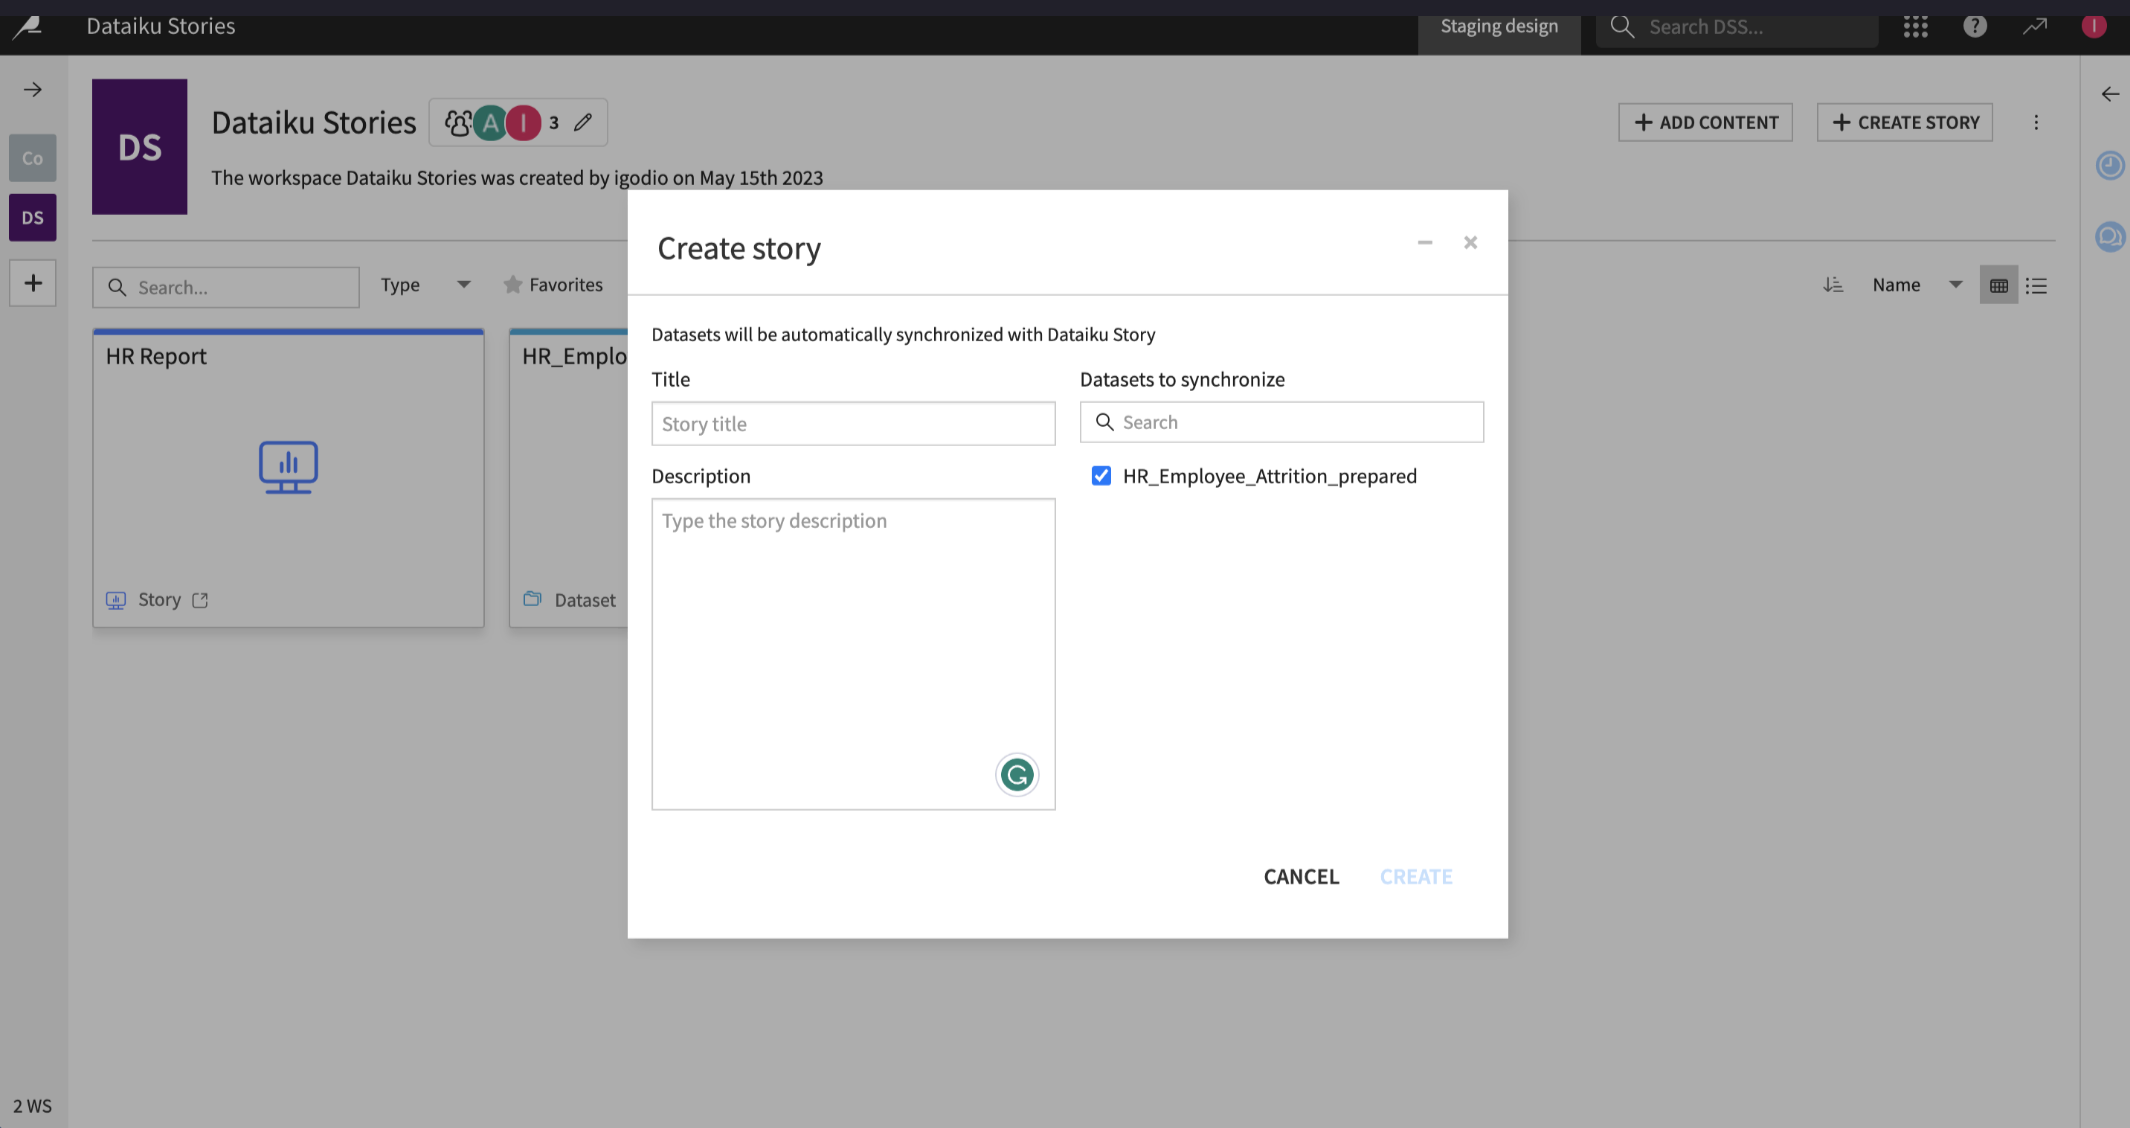
A story is the object created in a workspace and that contains all the slides you want to create for later presentation and collaboration.
Through a drag-and-drop visual interface or using generative AI, you can collaboratively create meaningful content. Content that can be created in the slides are:
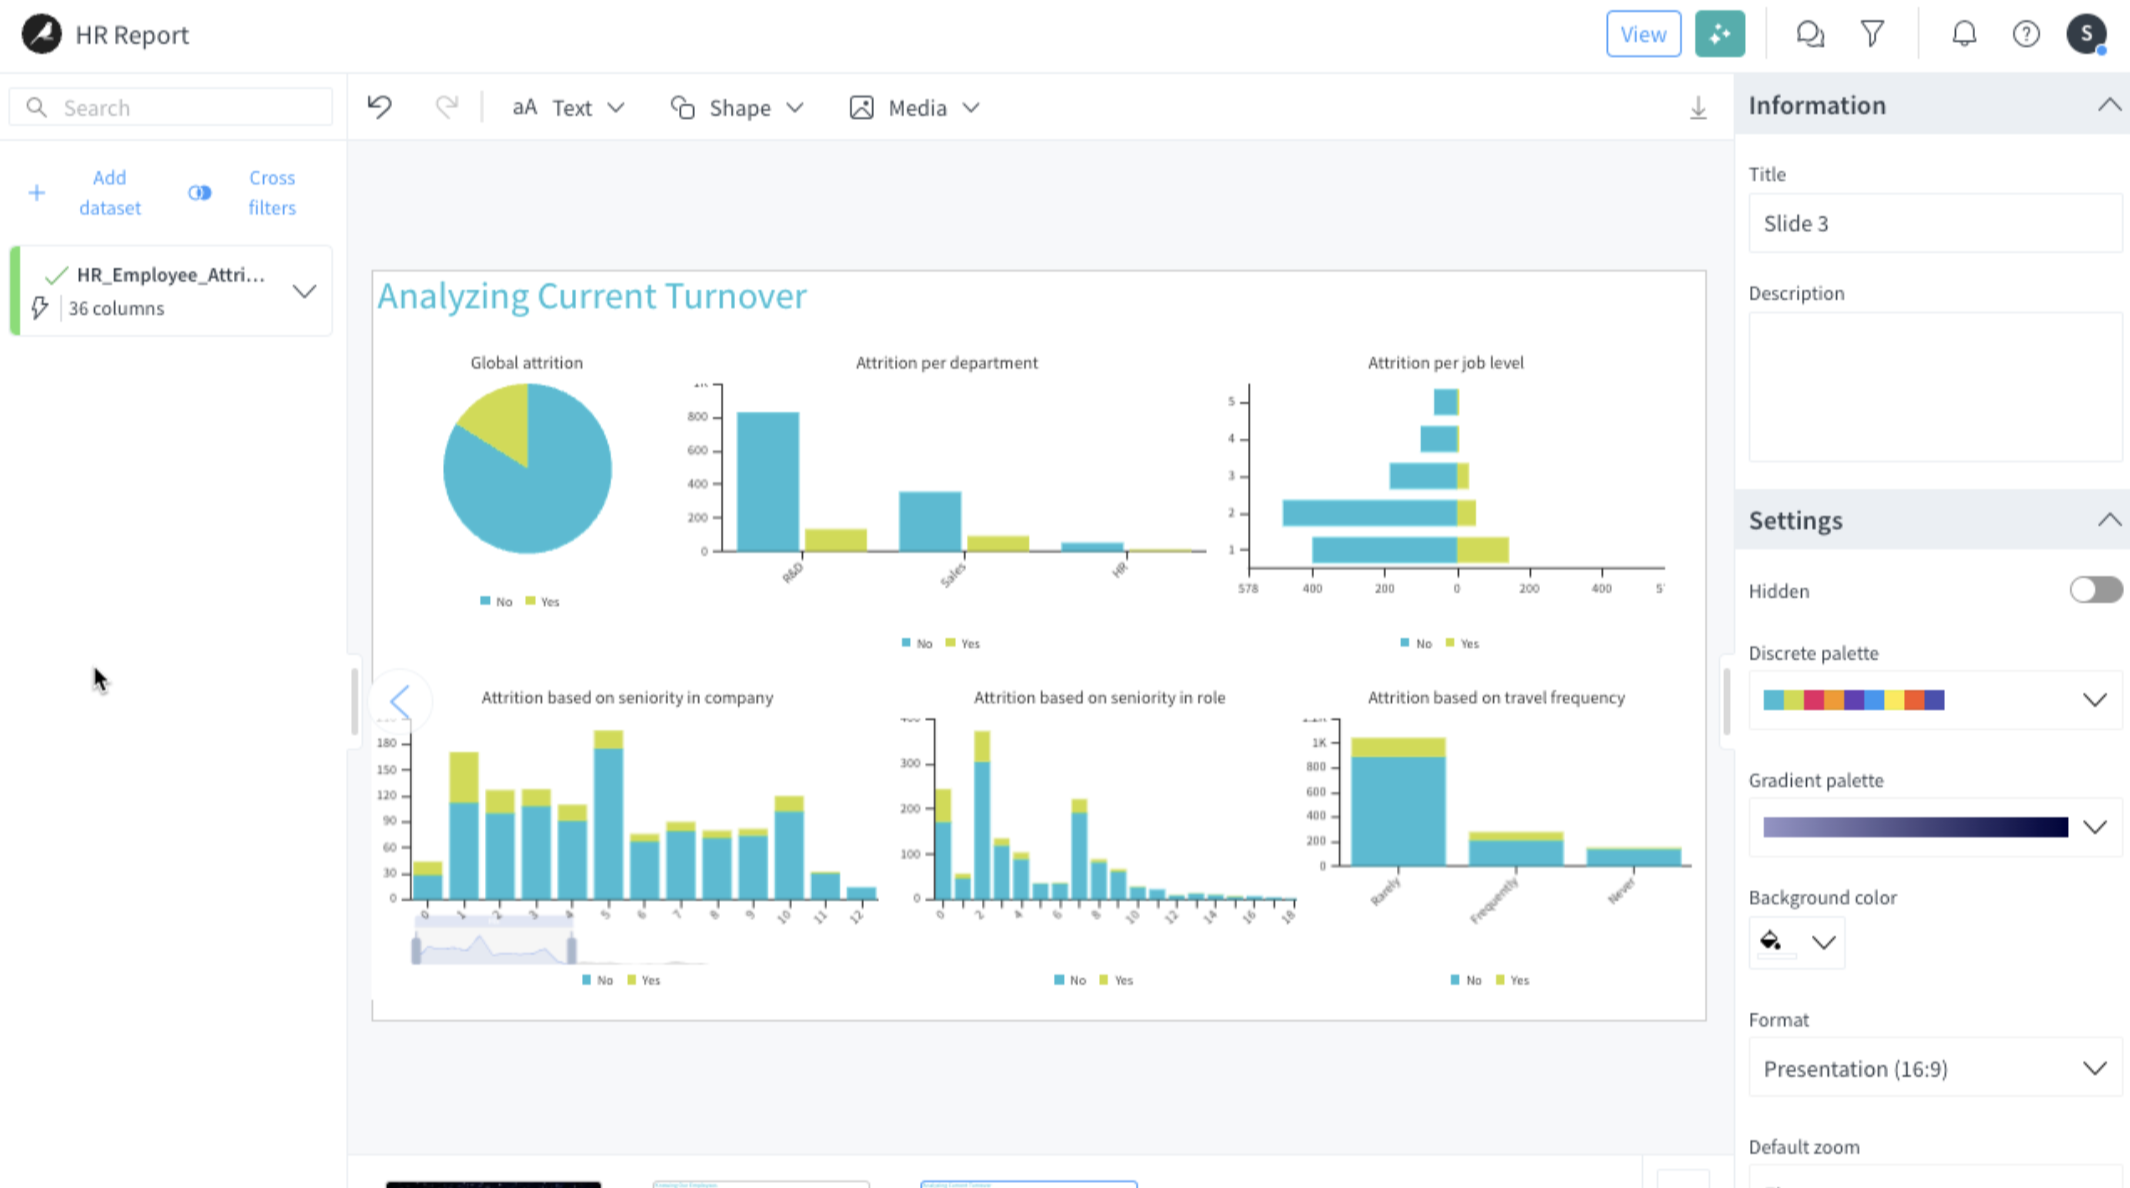
charts and filters: created from the datasets and updated as the data changes
texts, shapes, images and videos
collaboration: annotations and comments
See also
To learn more on how to build workspaces, see Tutorial | Workspaces. To learn more on how to build stories, see Tutorial | Build and edit a story manually.
Generative AI (Gen AI) features
Dataiku stories includes many Gen AI tools to help you build the best stories from your data, helping users get to grips with the tool by using text and prompts ranging from the simplest to the most specific ones. They are involved in many different ways:
Presentation assistant: You can give instructions to generate a complete presentation with slides, charts, texts and images. You can also give instructions to modify existing slides, charts, texts or images, whether they were created using Gen AI tools or manually. Hence, you can take an iterative approach where you first ask for generating a presentation and then provide more instructions on what needs to be adjusted on created slides, like adding filters, creating or customizing different elements, adding more slides, etc.
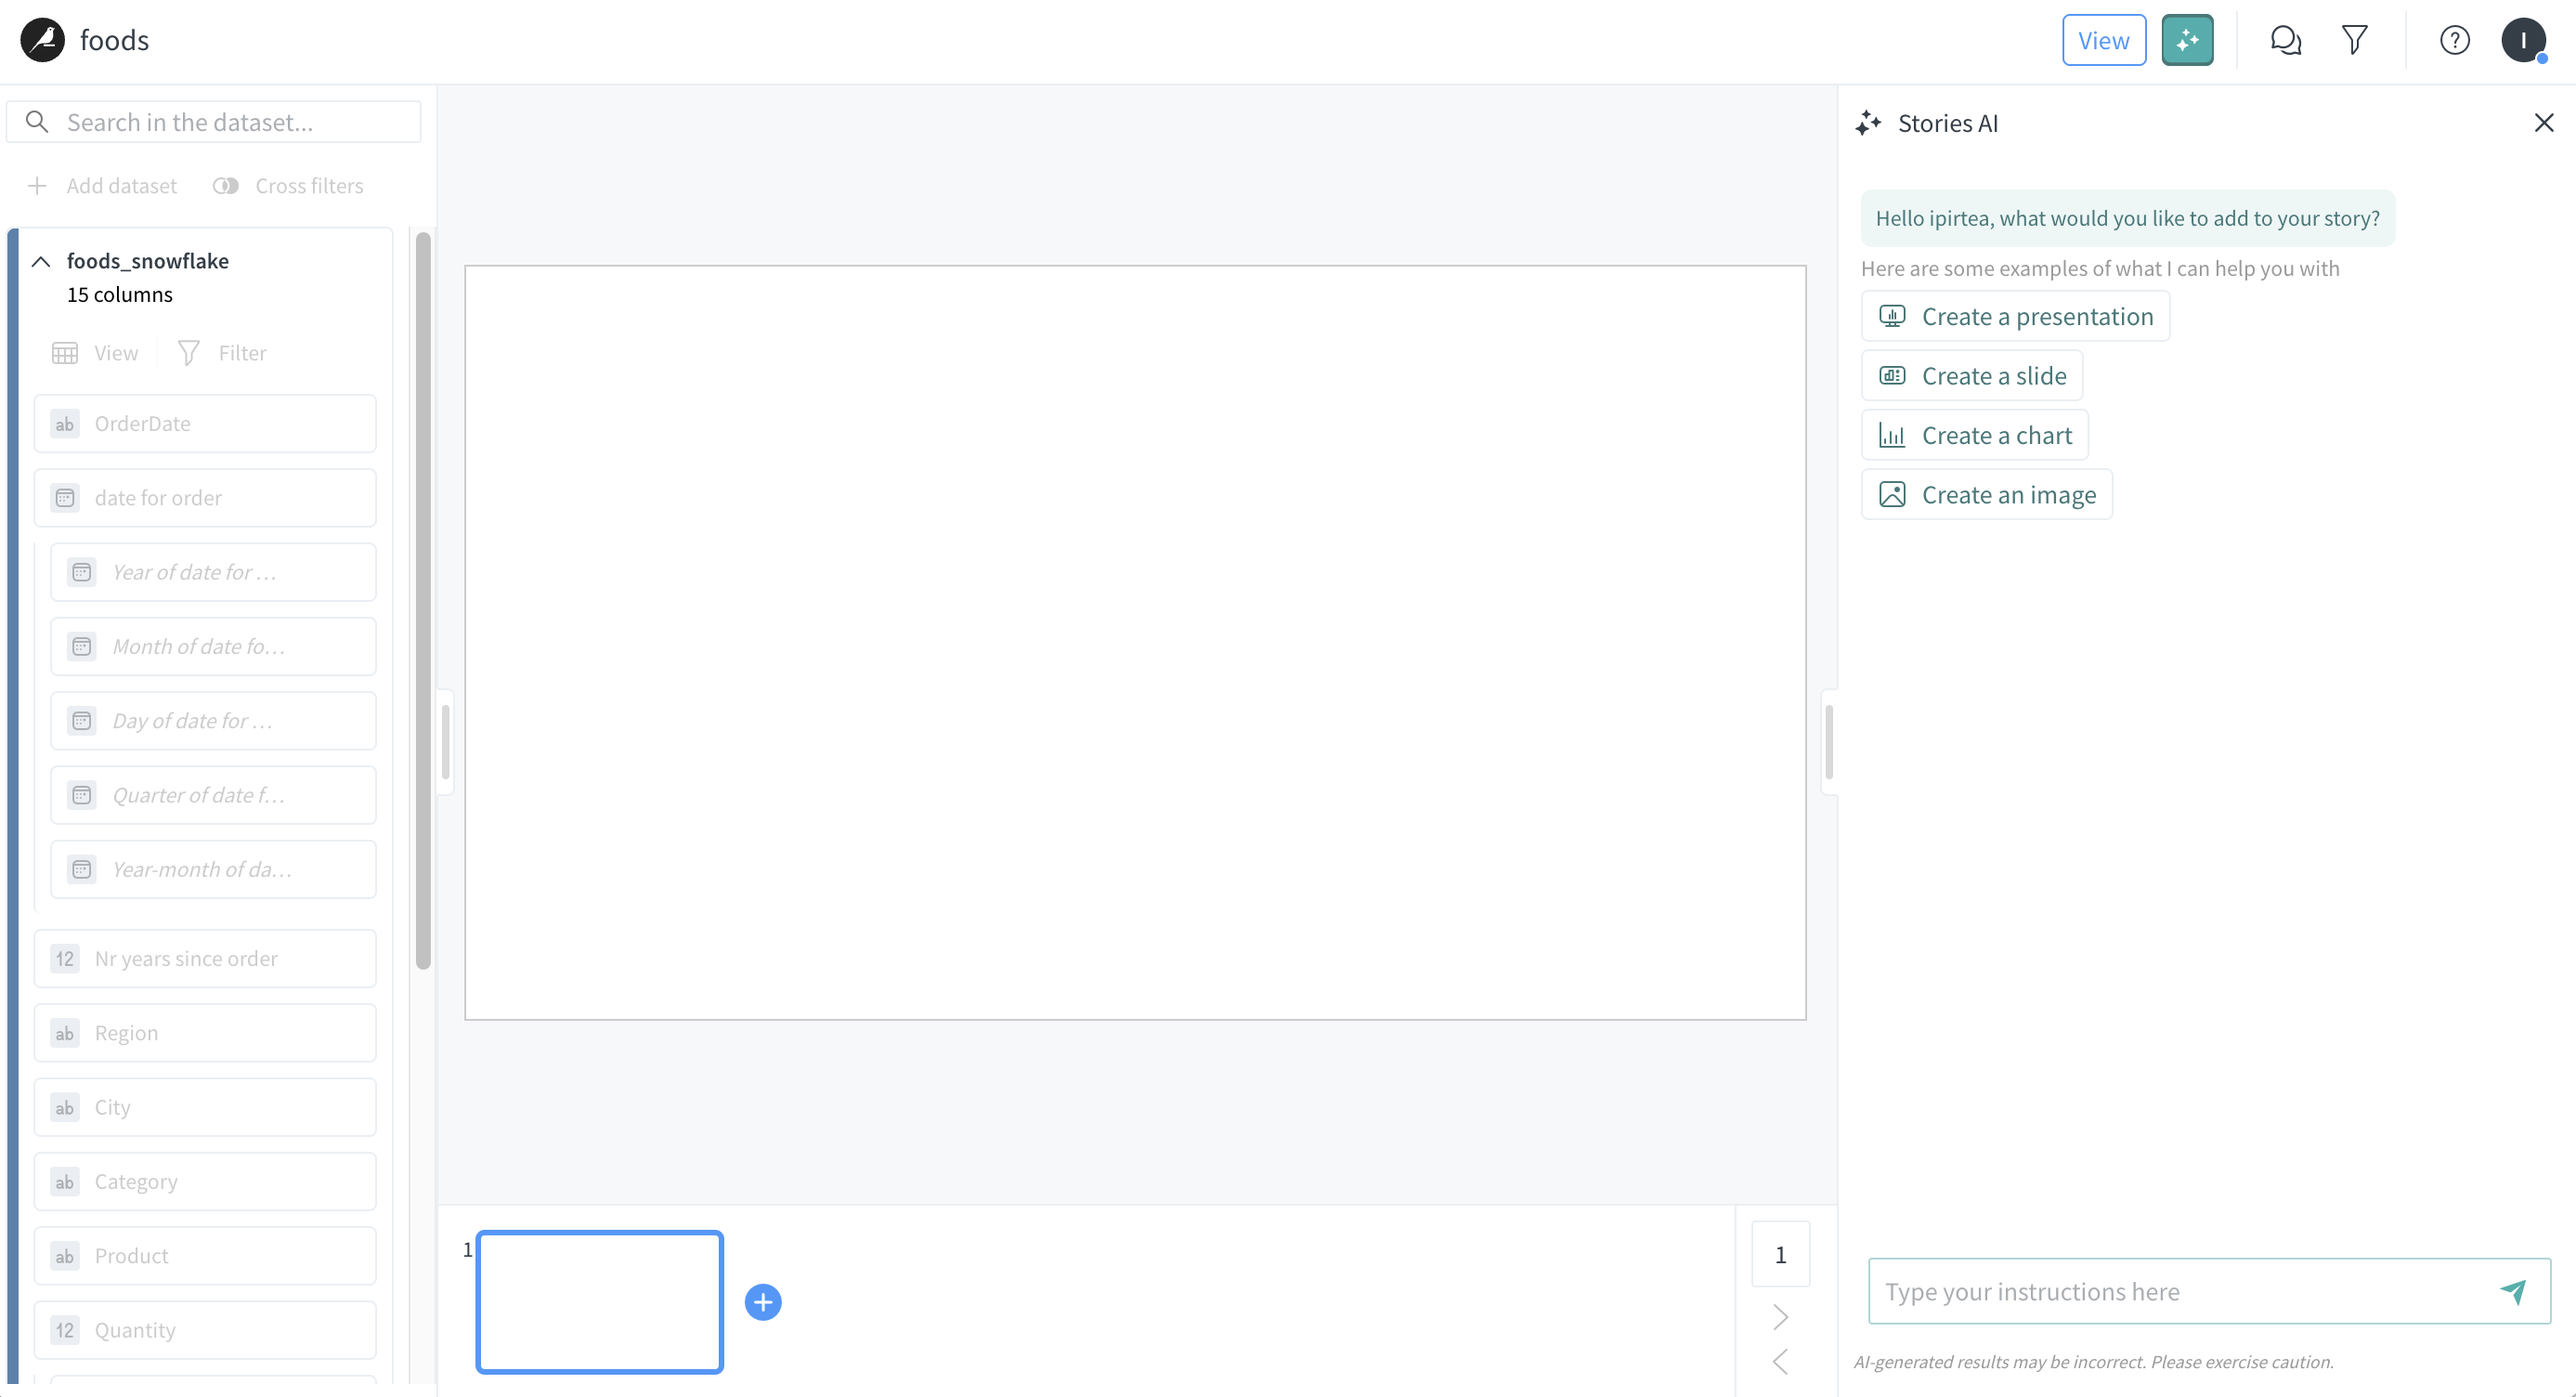
Chart assistant : Focuses specifically on charts. With the chart assistant, you can generate charts and modify their settings such as the titles, colors, border styles, and more.
Image assistant : Generates images on demand through the text helper or other options such as the Media menu.
Text helper : Helps you generate a paragraph or an image based on simple words. When you click on a small text, you have the option to Generate a paragraph or Generate image, which calls the text helper to generate a few sentences or a usable image, respectively, based on the text input. Once generated, you can apply this content as is, regenerate, or discard it otherwise.
See also
To learn more on how to use the generative AI features, see Tutorial | Create Dataiku stories with Generative AI.
Dataiku Stories Themes
Dataiku Stories themes allow you to share your corporate colors and guidelines across all presentations. All users can customize themes for a presentation, and administrators can download and share these customizations by creating new themes.
Applying a theme
Follow these steps to apply a theme from the ones available in your instance. Locate the theme panel and select the theme for the current presentation by clicking on it:
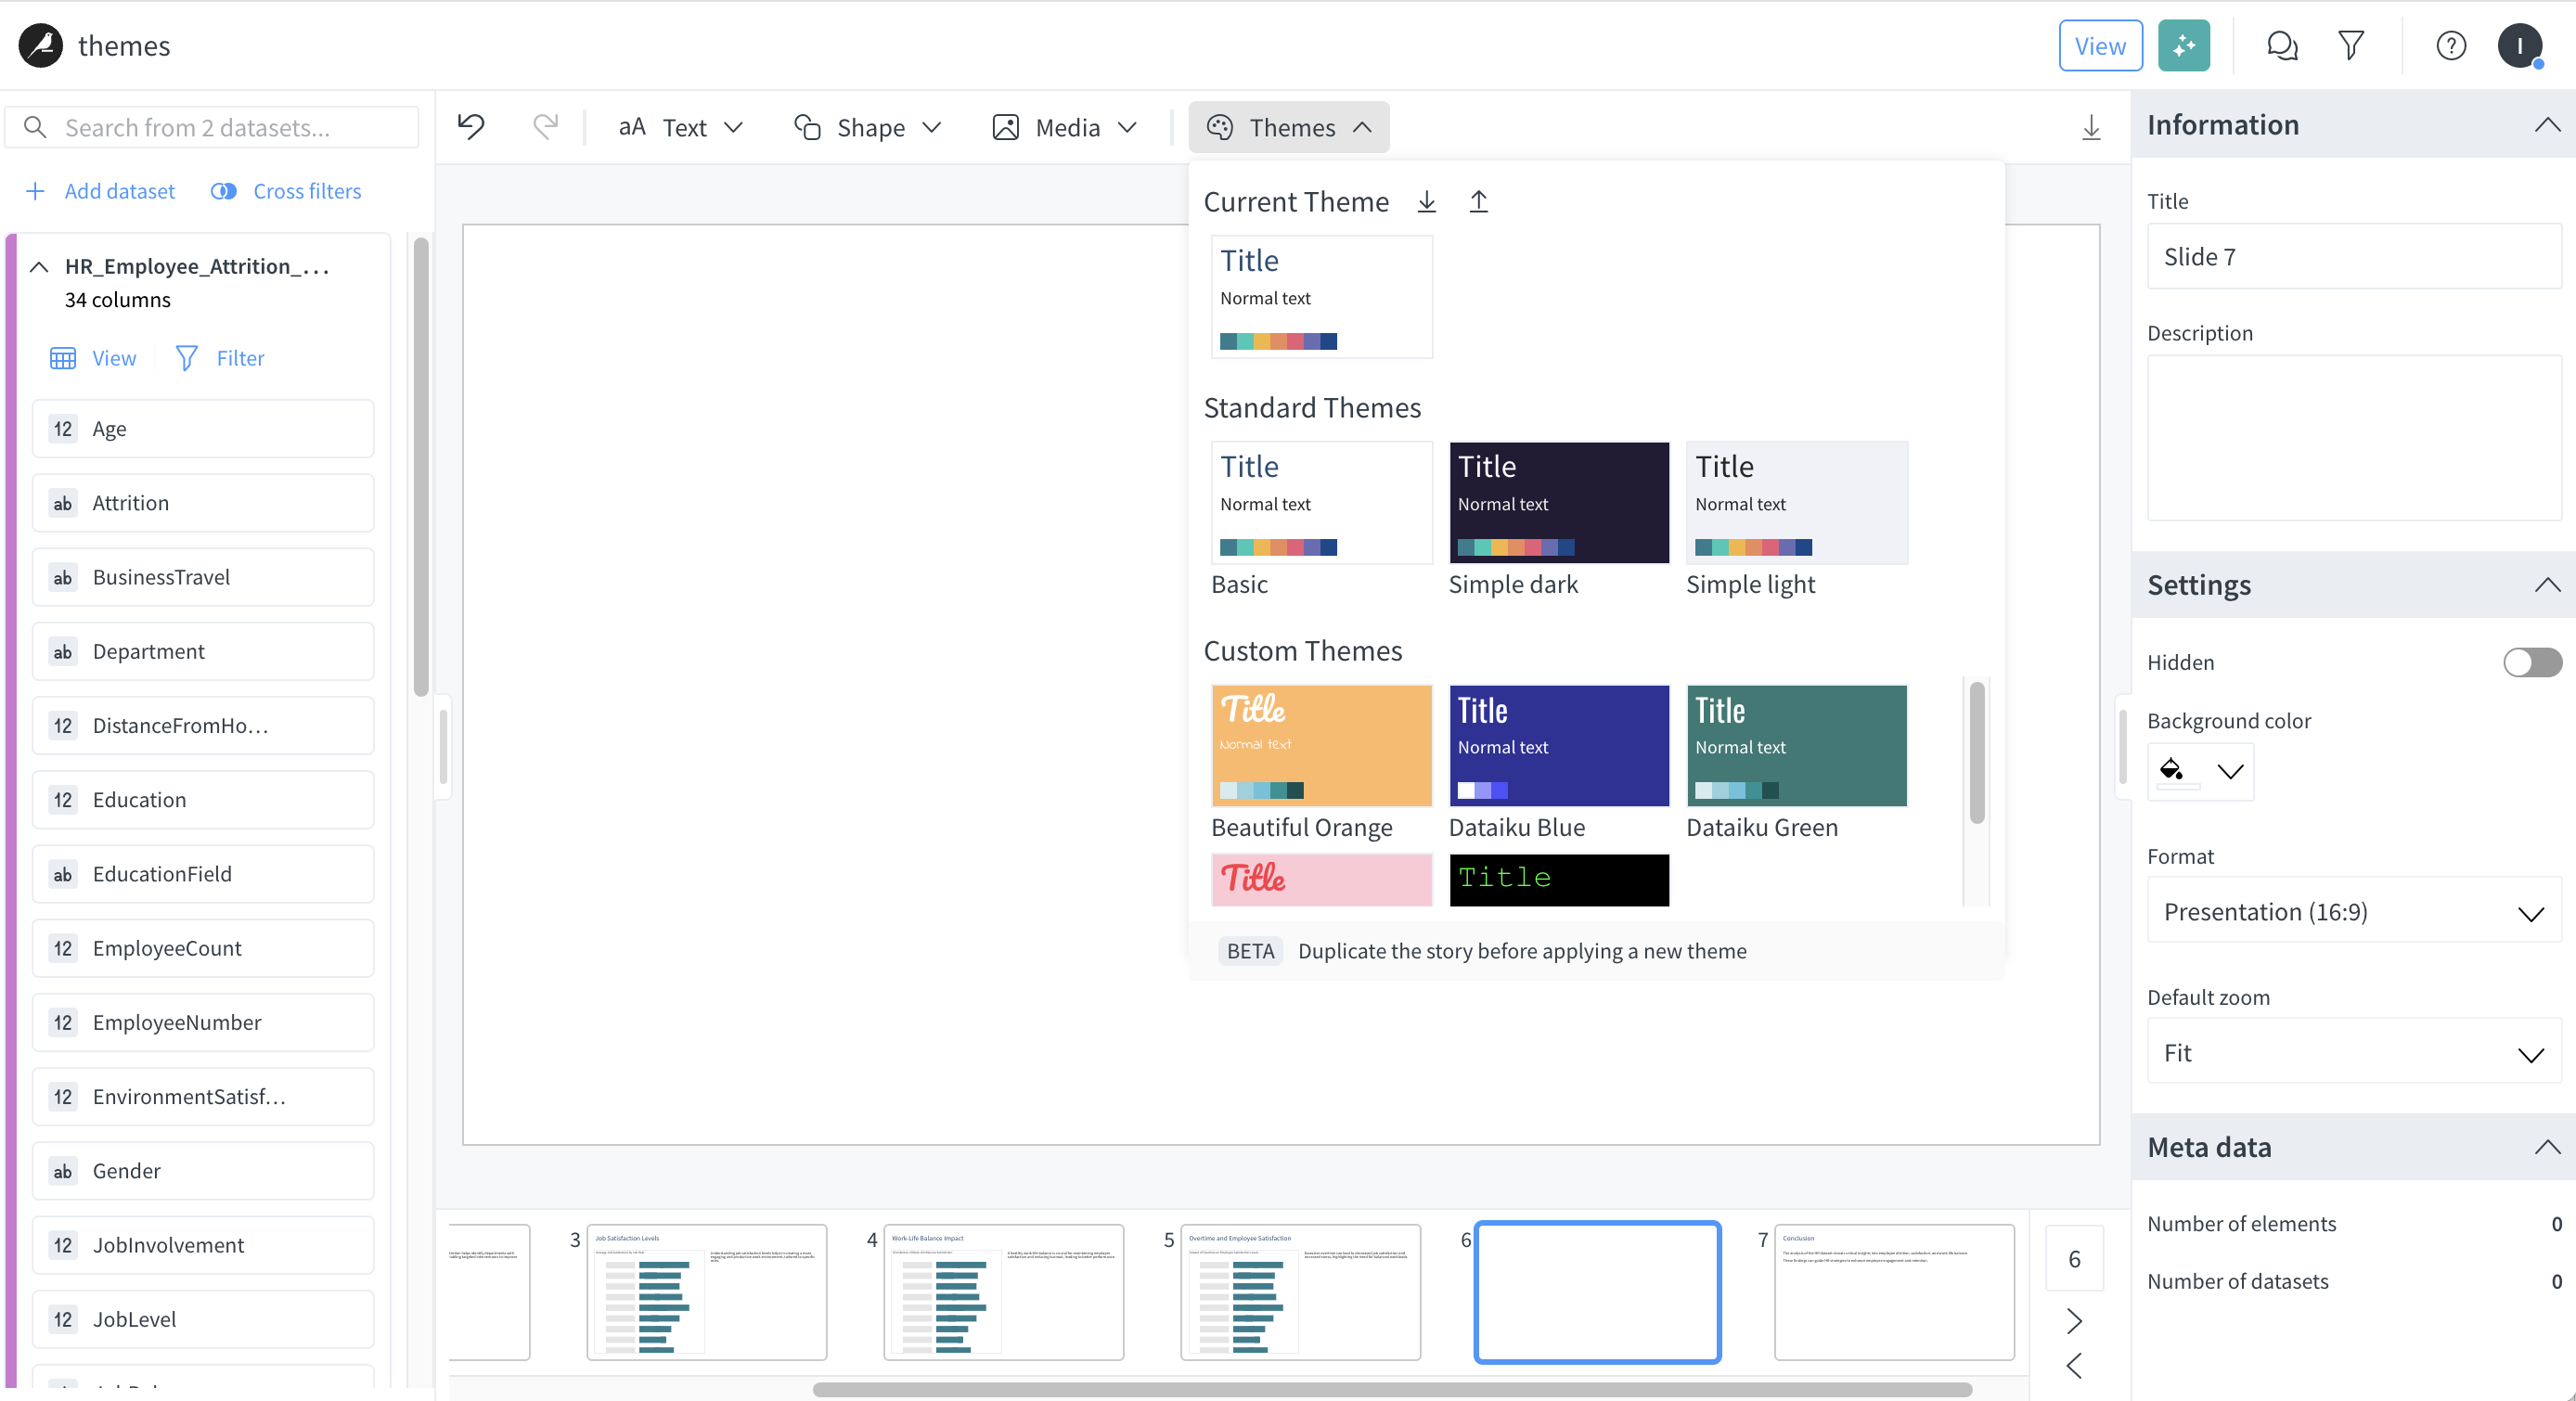
When applying a theme, the new theme styles will override objects(charts, texts, images, shapes) styles of a presentation that were not manually edited. It’s possible to revert the application of a theme using the “Undo” action.
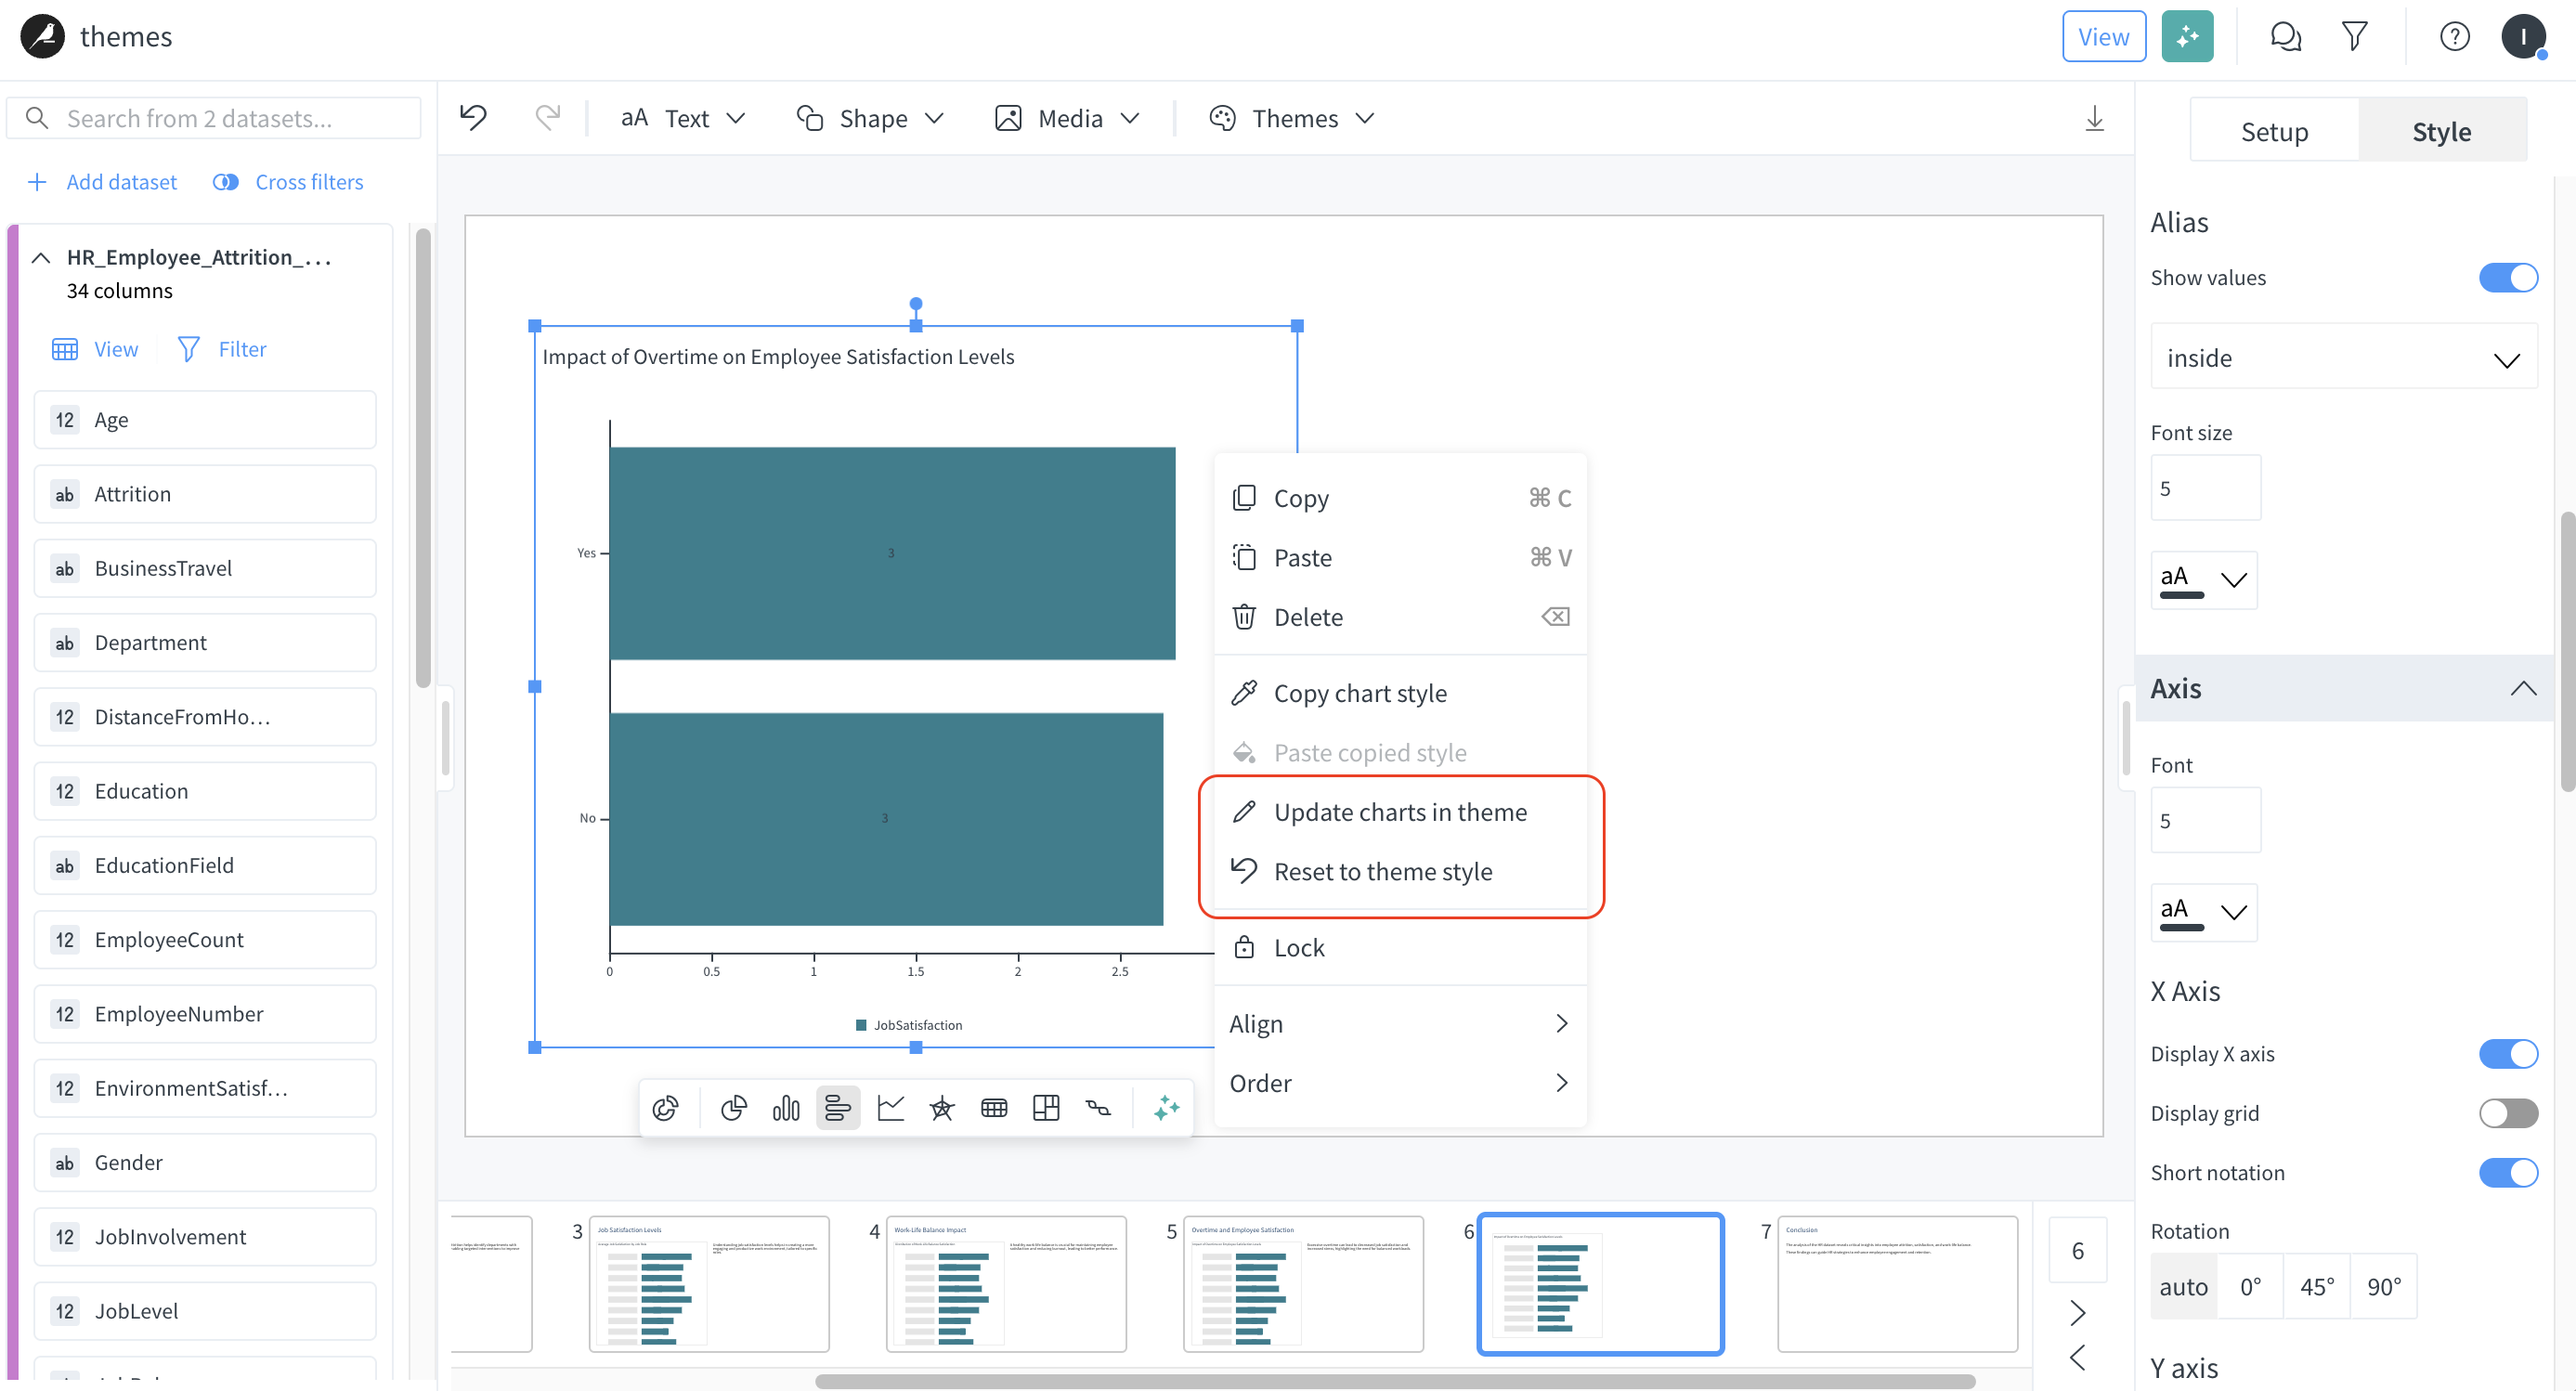
For each presentation, the theme selected can be customized for the current presentation by editing the properties of a specific object (charts, texts, images, shapes) and then update the changes in theme from the contextual menu. Below there’s an example for updating the theme after editing a chart. In the same way, when an object is manually edited then it’s possible to revert to the theme style. The changes done to the theme will be reflected only in the current presentation (the current theme of the presentation).
Create and manage themes
Creating a theme starts with customizing an existing theme. All users can download a theme from a presentation but only administrators can make it accessible across your Dataiku instance. Custom themes shared across your Dataiku instance can also be deleted, and theme definitions can be downloaded.
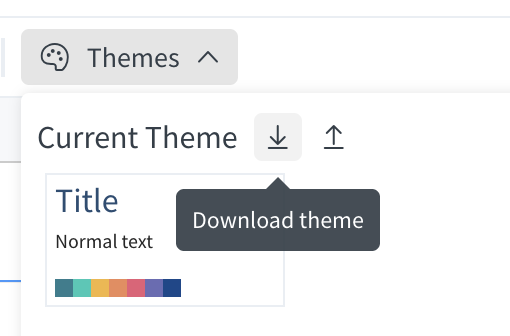
All users can download a theme as a JSON file from a current presentation and use it in a different presentation by using the upload action.
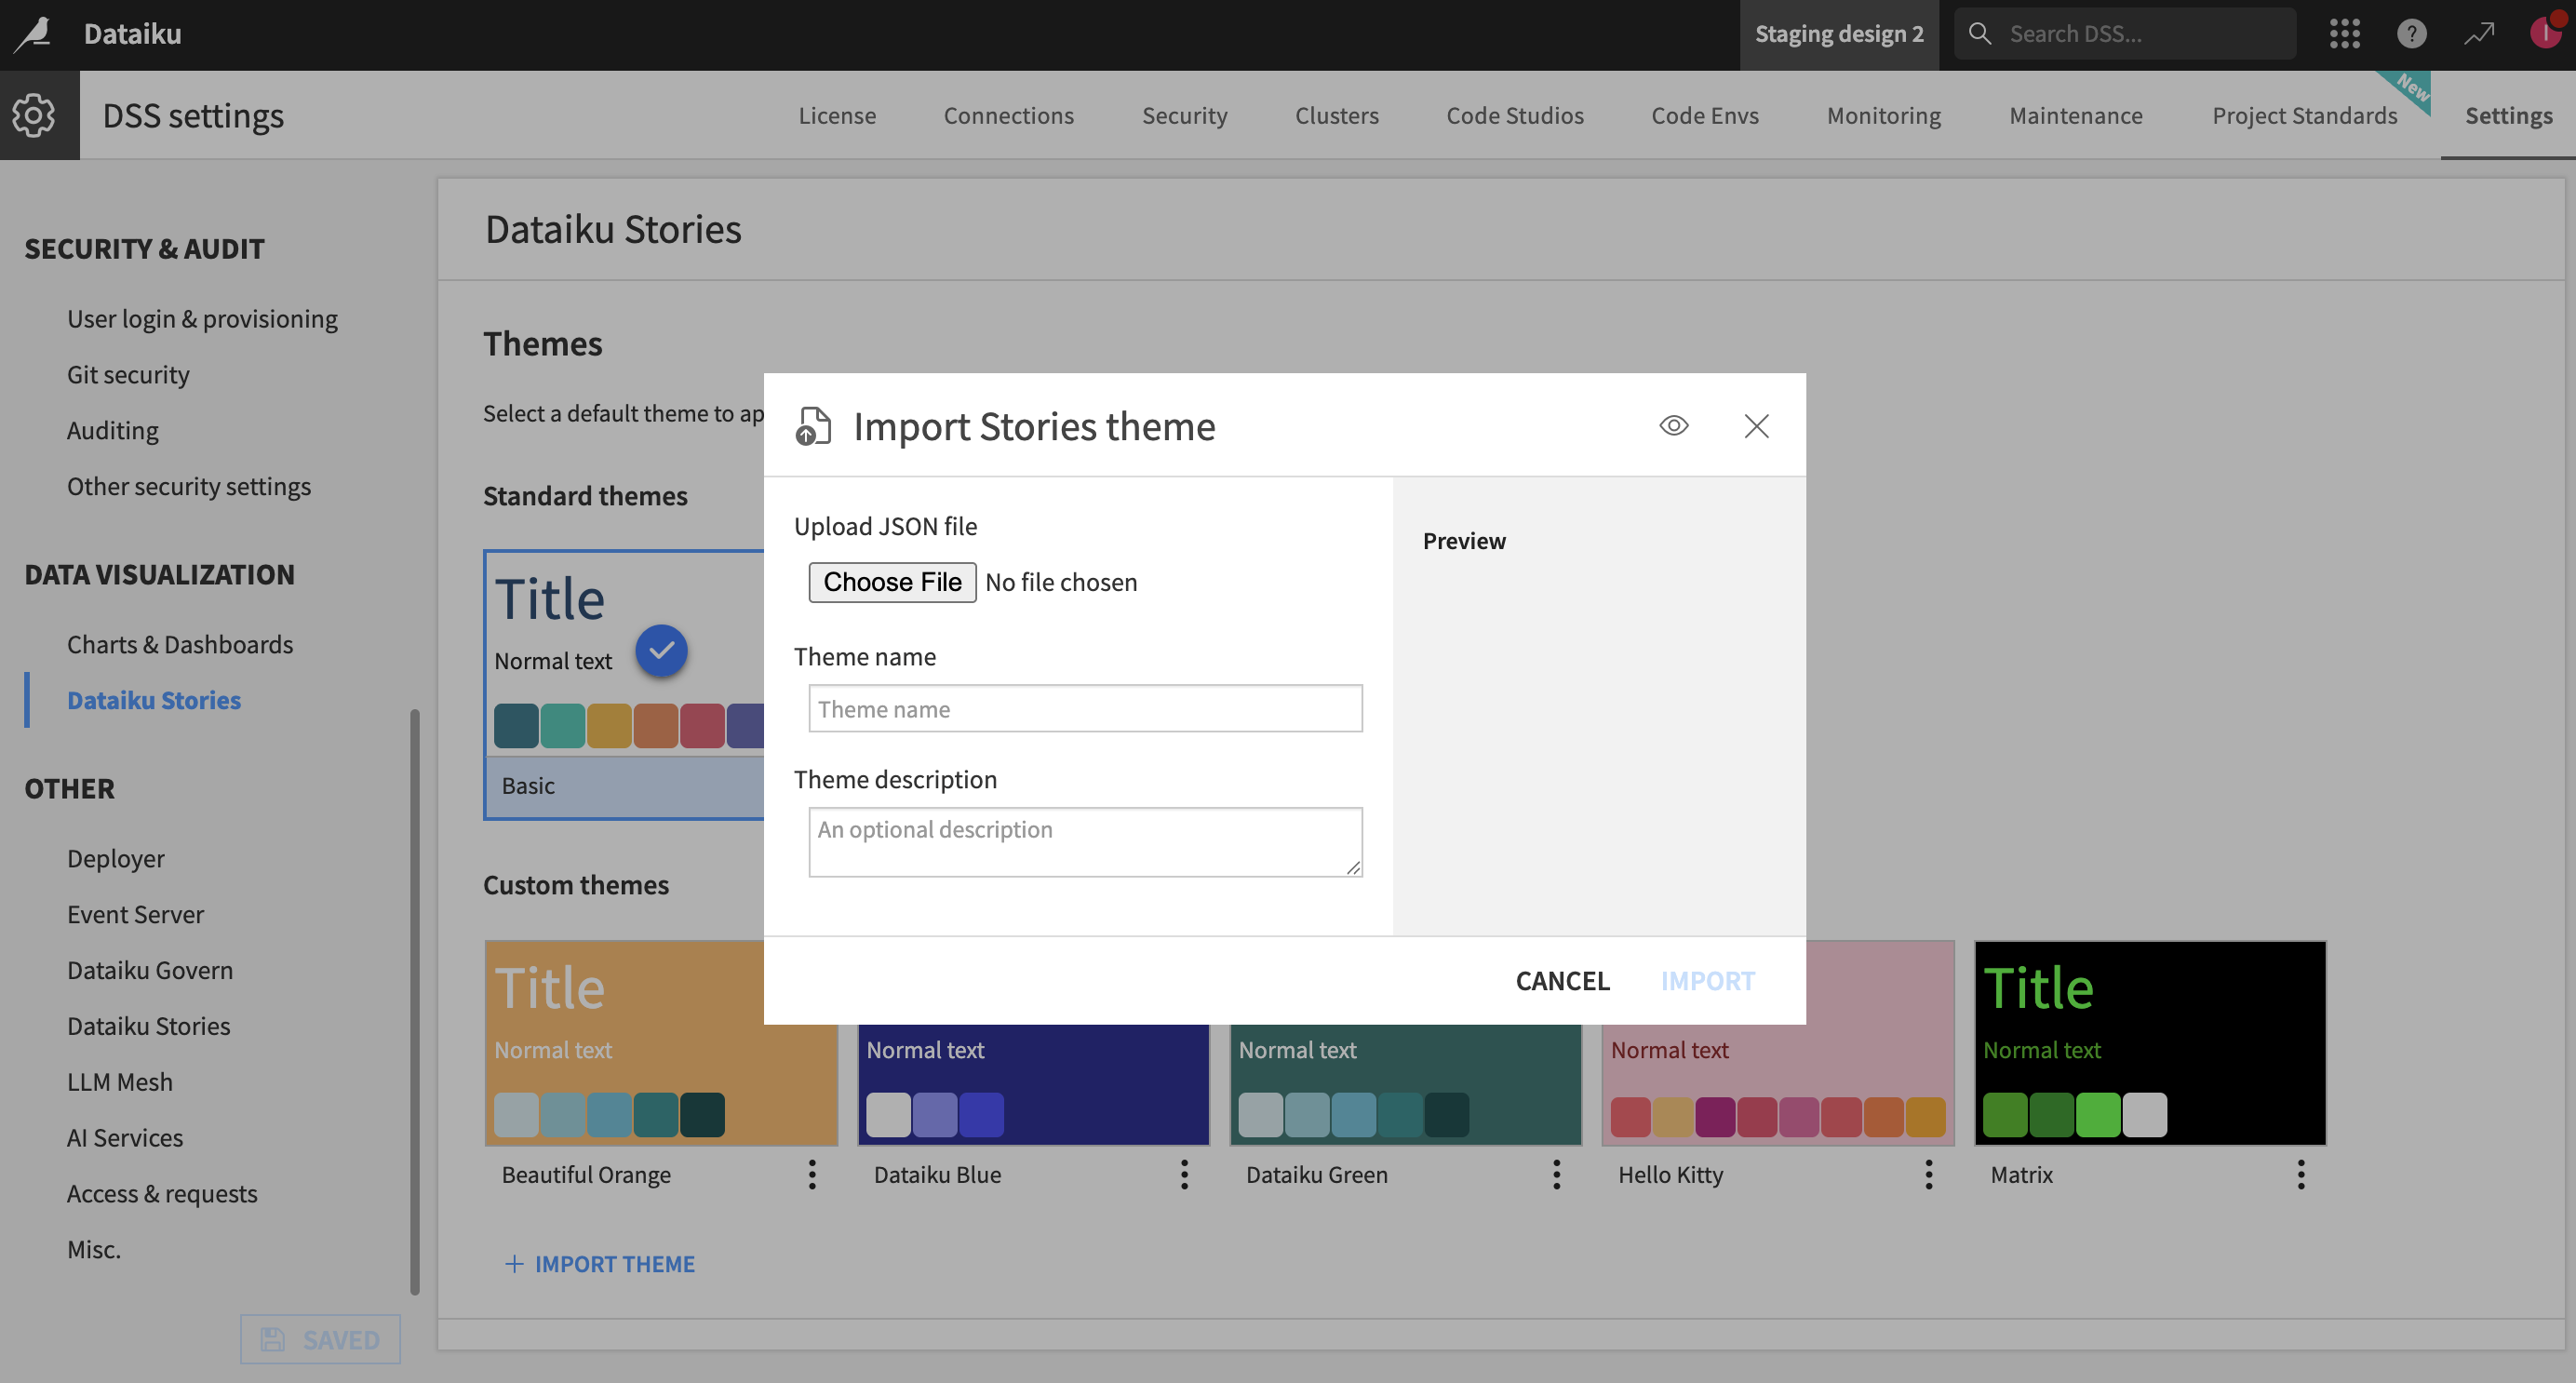
Only administrators can create instance custom themes by importing the theme’s JSON definition in the Administration settings, in the Data Visualization > Dataiku Stories section. From here, administrators can delete any custom theme. Deleting a theme won’t impact existing presentations using the theme.
Select the instance’s default theme
To select the instance’s default theme, navigate to the Administration settings and open the Visualization > Dataiku Stories. From there, you can select the theme by clicking on its miniature and saving the change.
The instance’s default theme will be used as the default theme for future presentations, but selecting a new instance’s default theme does not update existing presentations.