
Analyzing evaluation results
The evaluations comparison
A Model Evaluation Store contains several Model Evaluations. Each Model Evaluation may contain performance metrics and drift analysis.
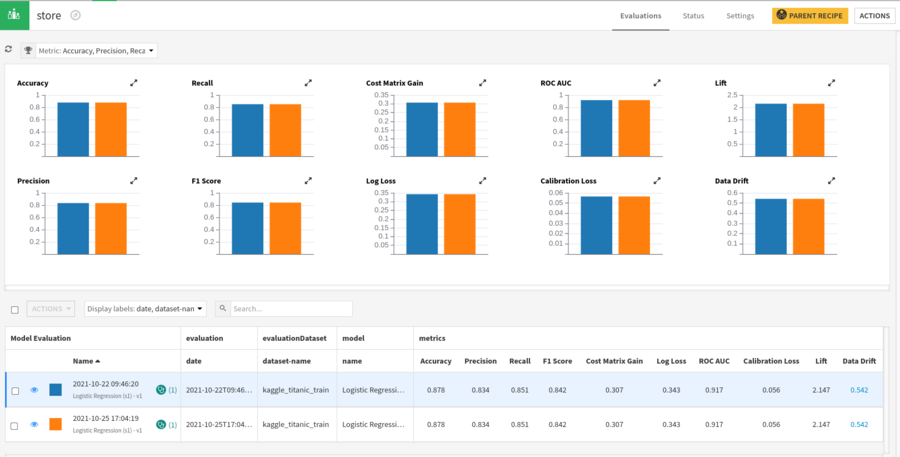
When you open the Model Evaluation store, you see all Model Evaluations in this store:
As a bar graph, when there are only 1 or 2 of them. In this case, you can select the metrics to display in the upper left combobox. You can also enlarge performance graphs by clicking on the opposing arrows at the upper right corner of each of them.
As a line graph when there are 3 or more of them. In this case, in addition to the settings available in the bar chart, you can also select which label is used as X in the graph and which combination of labels will be used to group model evaluation in lines (“Color”).
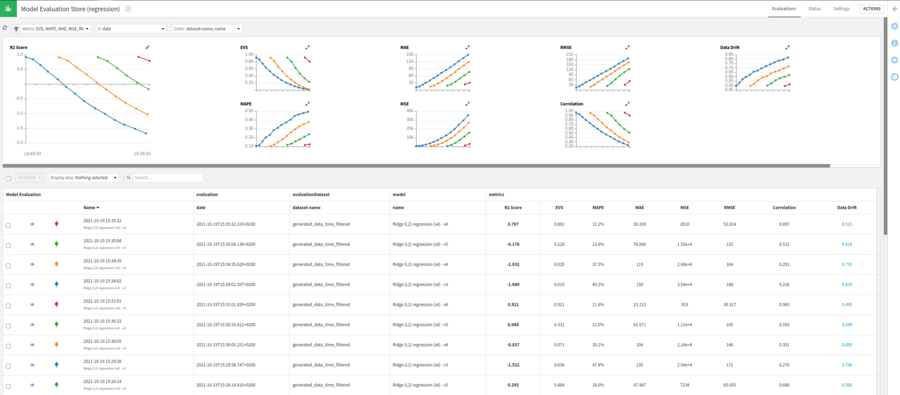
And as a table in all cases.

Each line of the table displays the name of the model evaluation, its labels, performance metrics if available and data drift metric if available.
Model Evaluation details
The details of a Model Evaluation are presented in a similar way to a Version of a Saved Model.
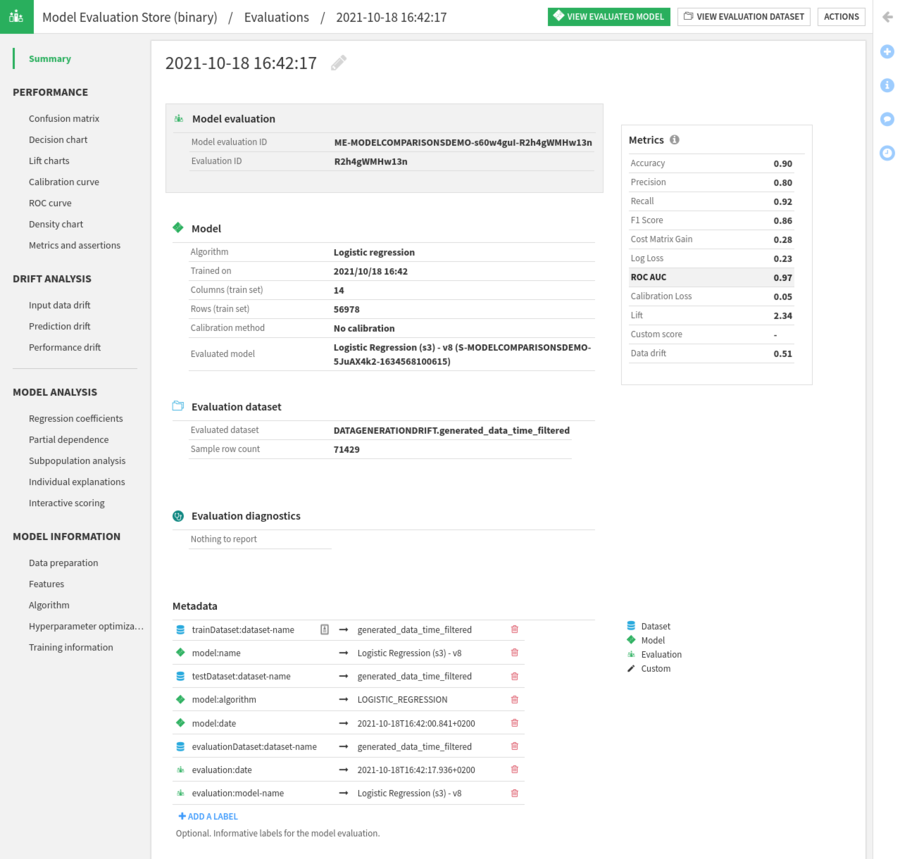
The key difference between the display of a Model Evaluation and the display of a Saved Model Version is that:
For a Saved Model Version, performance is computed against the test set
For a Model Evaluation, performance is computed against the evaluation dataset
Specific to Model Evaluation is the Drift Analysis section.
Using evaluation labels
By default, a Model Evaluation has in its Metadata a collection of automatically added labels.
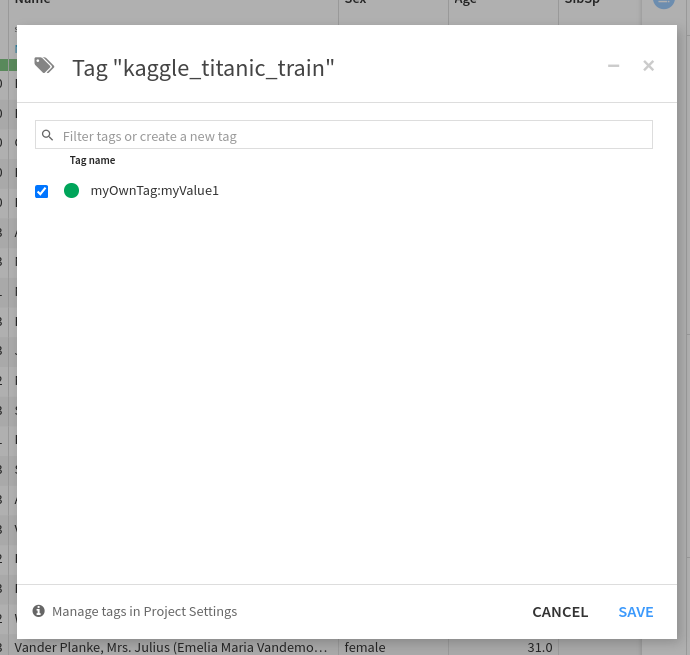
In order to add semantic to your evaluations, you can also add your own labels:
on the train and train time test datasets
on the evaluation dataset
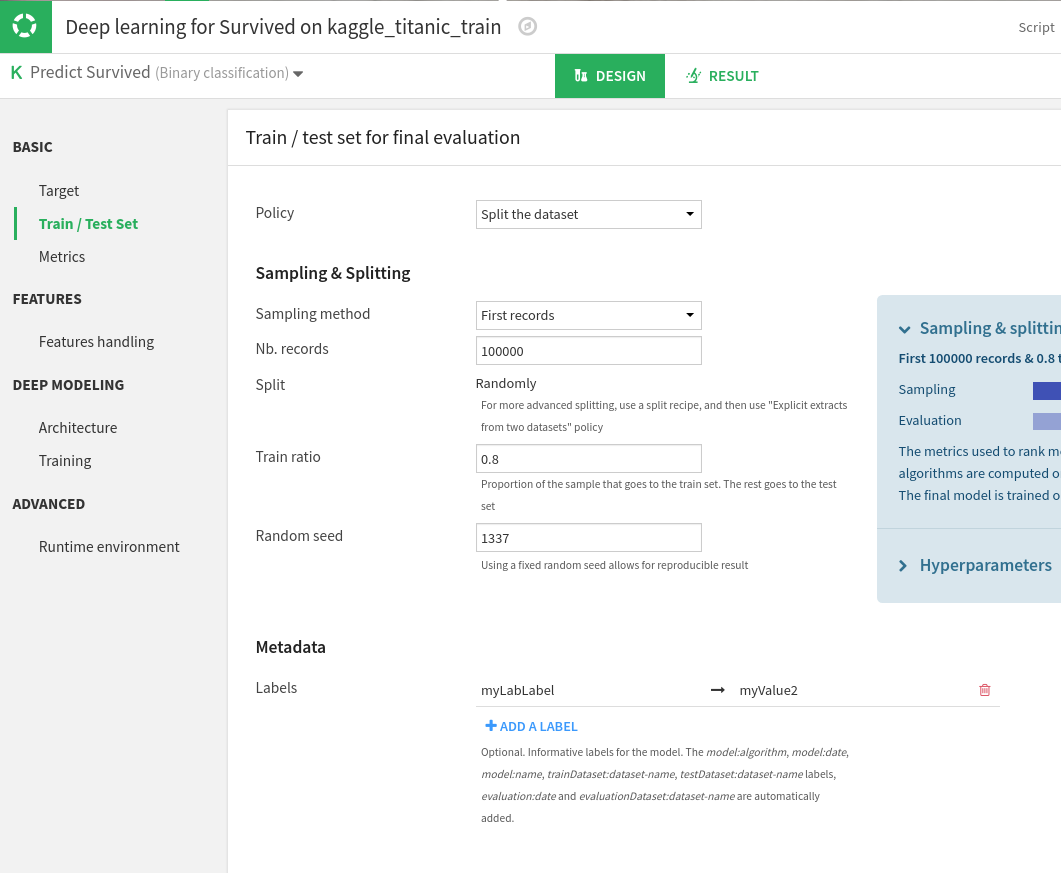
when designing a model in the lab
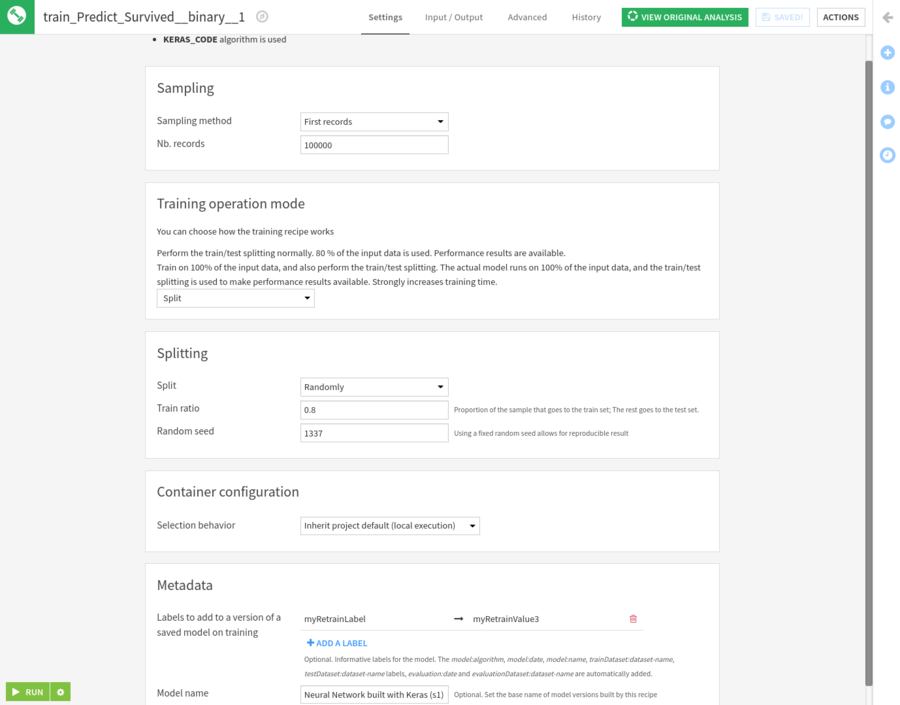
in the train recipe of a model deployed in the flow
in the (Standalone) Evaluation Recipe
For a dataset, labels are implemented as tags, with key and value separated by a semicolon.
In the Lab, custom labels may be added in the Metadata section of the “Train / Test Set” tab of the design of a model.
In the Train recipe, custom labels may be added to the Metadata section.
In the (Standalone) Evaluation Recipe, custom labels may also be added to the Metadata section.
Note: the value of all those labels may be parameterized. You may use a project variable as a label value. That project variable will be evaluated:
when the model is trained in the lab or in the flow, pulling labels from the train and test datasets with those of the lab model design or of the training recipe
when the model is evaluated, pulling labels from the evaluated model version, the evaluation dataset and the (Standalone) Evaluation Recipe.
Leveraging the labeling system, one can obtain ME with custom labels implementing its specific semantic:
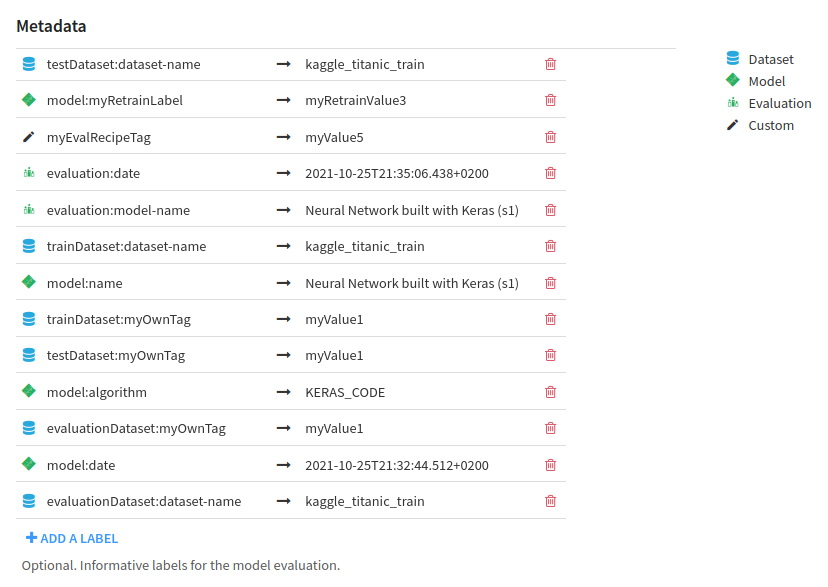
In this example, the train and test dataset were the same.
Those labels can then be used in the Evaluation store to customize the graphs. The X axis can, for instance, be the value of a custom label set at evaluation time. Those labels will be interpreted in the MES Evaluations tab:
as date and time, if they have the same format as dates in the above examples ;
as numerical, if convertible to numbers ;
else as text, lexicographically ordered.