
Analyze
In the Explore tab of your dataset, you can do some exploratory analysis by clicking on a column and choosing Analyze from the dropdown menu.
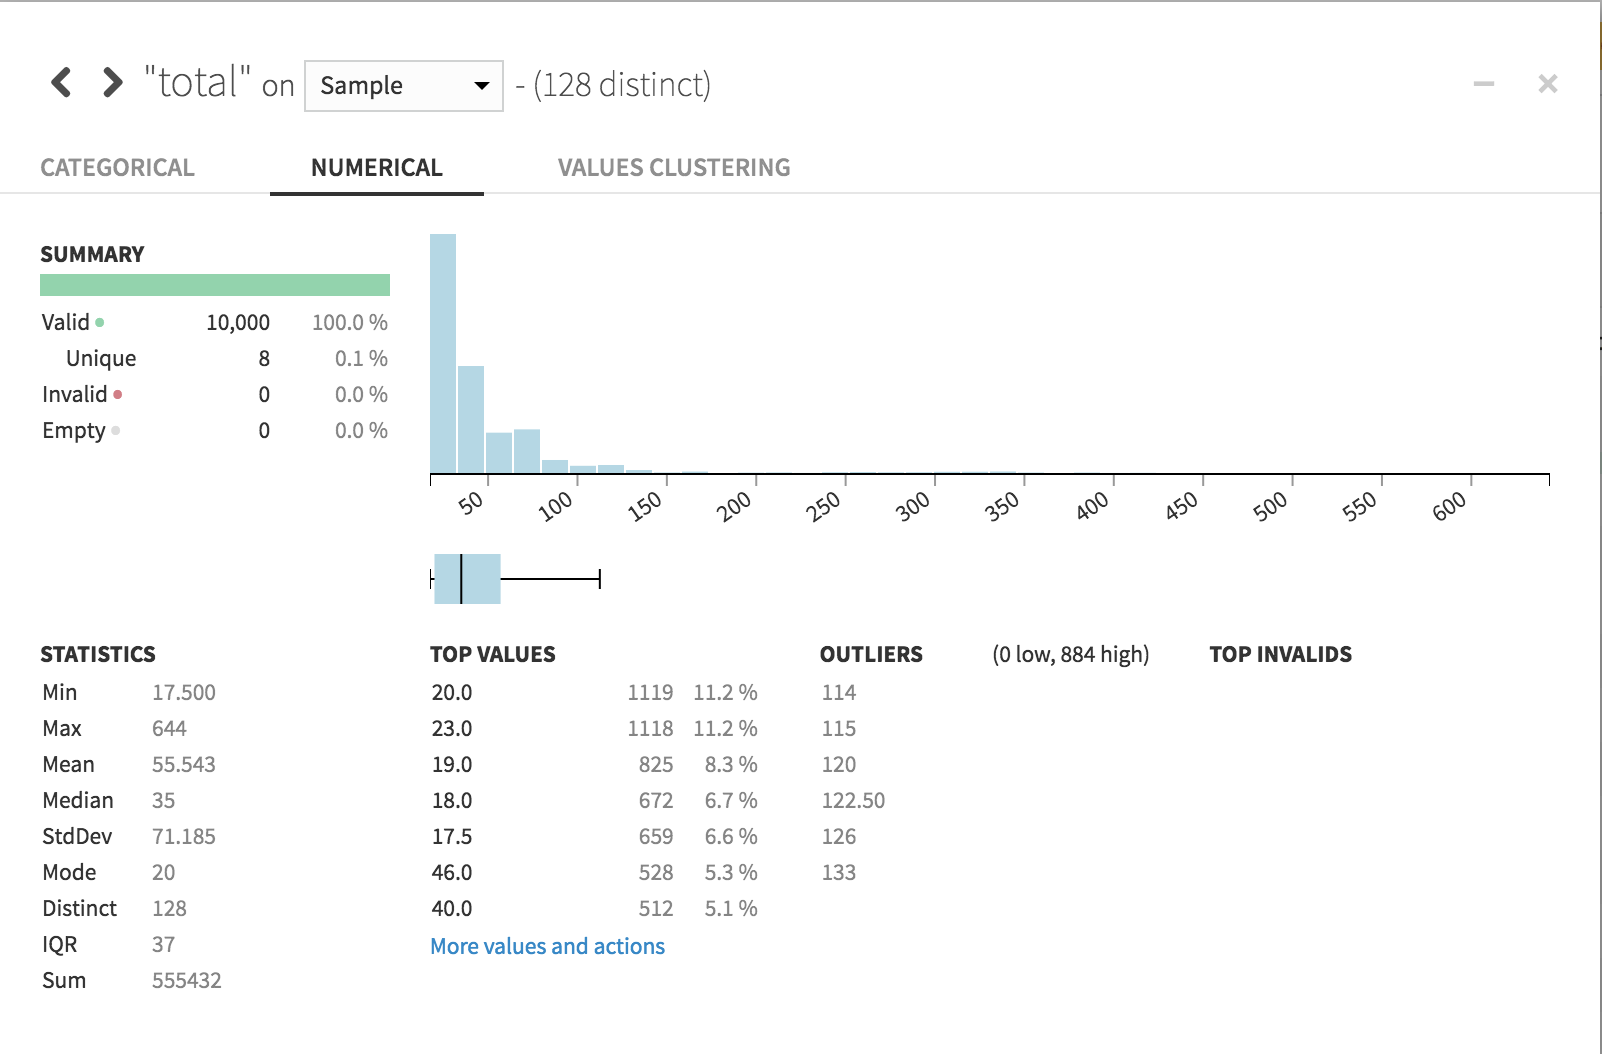
The resulting modal dialog provides some appropriate statistics and visualizations depending on whether your data are numeric:
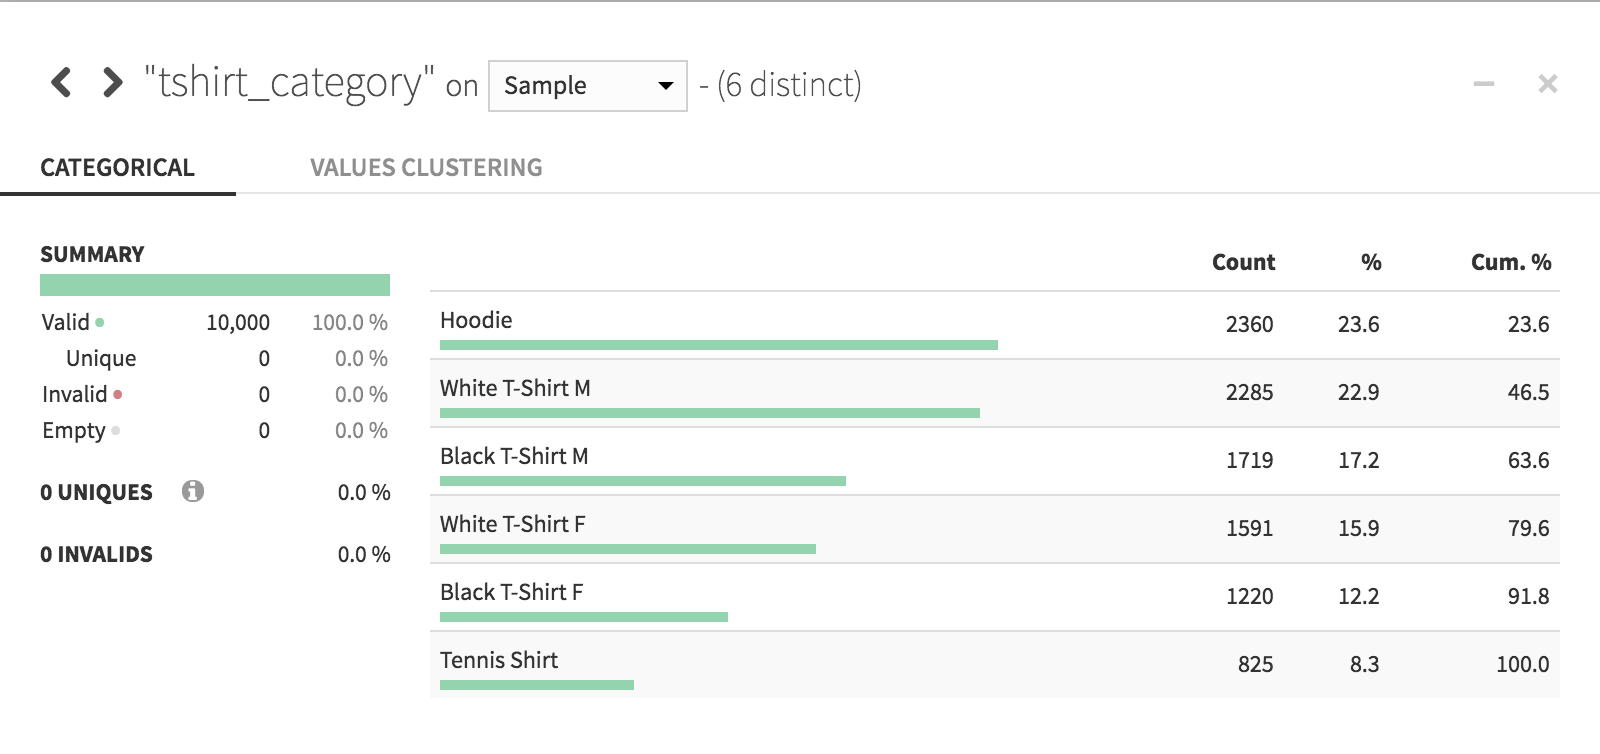
… or categorical:
In both cases, the default analysis is based on your Design Sample. Choose Whole data from the dropdown menu to base the analysis on the entire dataset.