
Filter settings
Filter settings allow you to fine tune how filters are expected to behave.
Include/Exclude other values
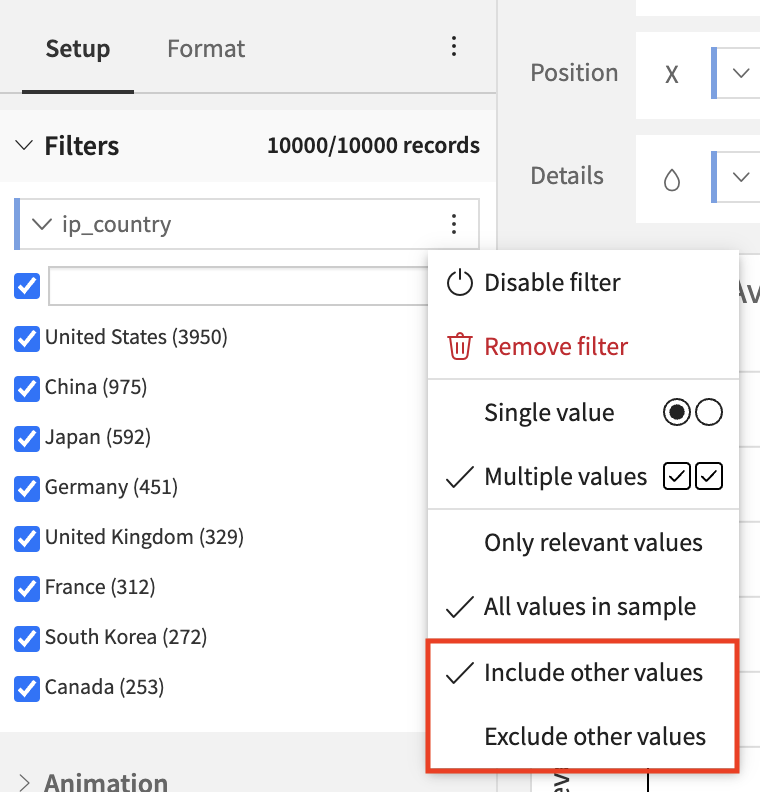
This option is available for alphanumerical filters and its main role is to allow to choose how values that will be added to the dataset in the future will affect the dashboard. In exclude mode, new values will be filtered out while in include mode they won’t.
Note
For dashboard filters, this option also controls whether to display or not values that are present in a filterable insight but not in the filters tile. In exclude mode, these values are filtered out while in include mode they aren’t.
A value can be displayed in a filterable insight but not in the filters tile if the underlying datasets or sampling options are different.
Dashboards default behaviour is Exclude other values. Charts default behaviour is Include other values.
Only relevant values/All values in sample
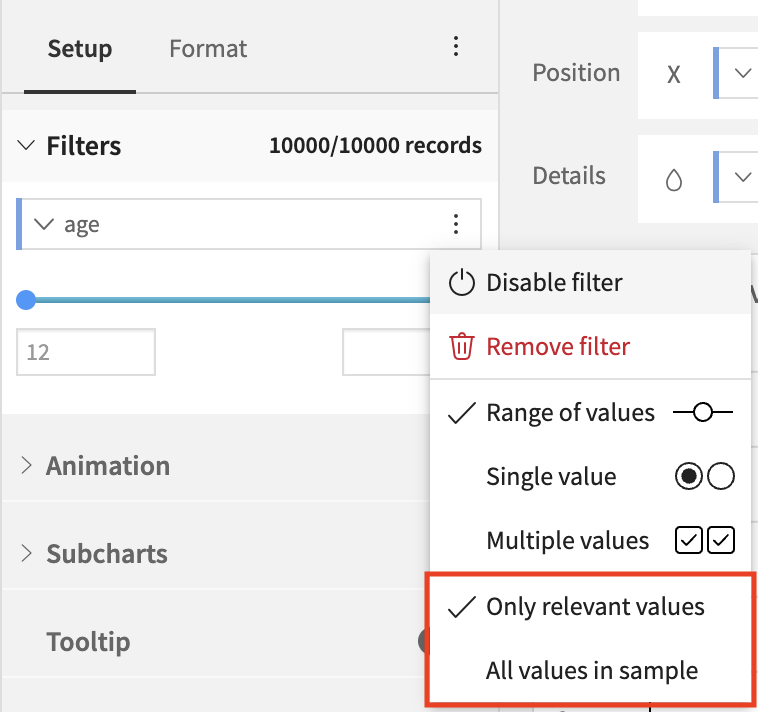
This option is available for all filter types and allows to choose if:
the values available in the filter should be restricted based on the other filters: Only relevant values.
all values should be shown without taking into account the other filters: All values in sample.
Dashboards and Charts default behaviour is Only relevant values.
Aggregation filters
Aggregation filters let you filter chart values based on aggregated values instead of raw ones.
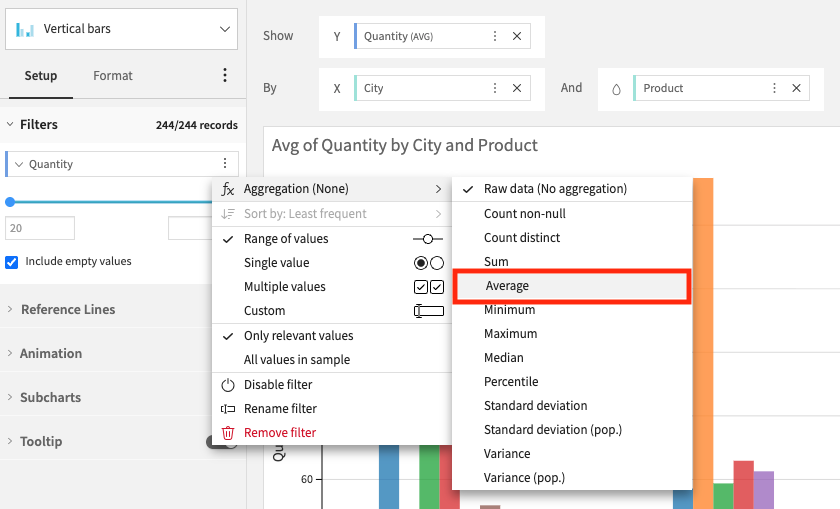
Creating aggregation filters
You can create aggregation filters in three ways:
From an existing filter, open the filter menu and change the aggregation function. Select an aggregation function to convert a standard row filter into an aggregation filter. Select Raw data to switch back to a standard row filter.
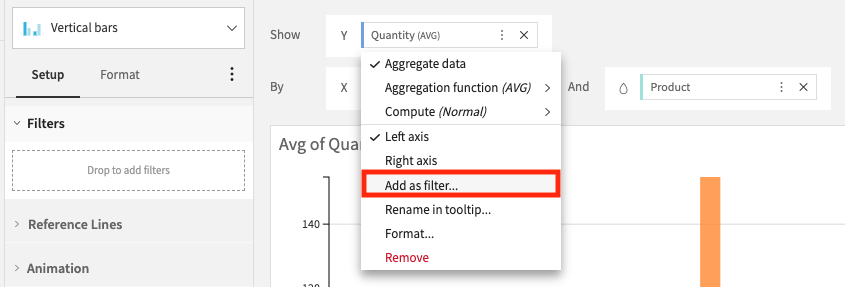
From a measure menu, use Add as filter command.
Drag and drop a column directly into the aggregation filters dropzone when there is already one.
Compatibility
They are compatible with aggregations returning numerical values, including:
Count of records
Custom aggregations when their output is numerical
Modes
Aggregation filters provide two modes:
Constraint: define one or more numeric constraints on the aggregation value.
Top N: keep only the Top or Bottom N values of a selected ranking dimension.
Constraint mode
In Constraint mode, you can configure one or more conditions on the computed aggregation.
The Compute by setting defines the scope used to compute this aggregation:
All chart dimensions: the aggregation defined in the filter is computed over all chart dimensions.
A single dimension: the aggregation is computed along the selected chart dimension only.
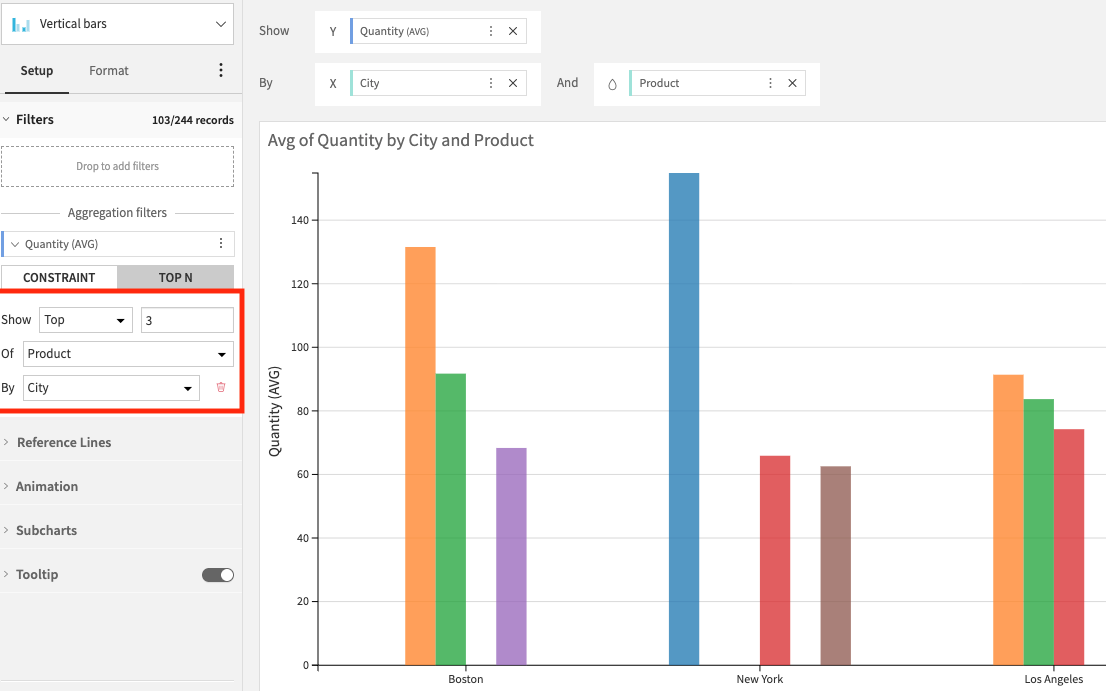
Top N mode
In Top N mode, you configure:
whether to keep Top or Bottom values
the N limit
the ranking dimension in the Of selector
By default, ranking is computed on the whole chart.
If you enable Rank within groups, ranking is computed within selected partition groups (using chart dimensions) instead of on the whole chart.
Grouping scope
When ranking within groups is enabled, you can choose to compute this ranking by:
All chart dimensions, except the selected ranking dimension.
A single chart dimension, except the selected ranking dimension.
If the chart has only one dimension, partitioning is not available.