Other Charts
These charts do not fit neatly into other classifications.
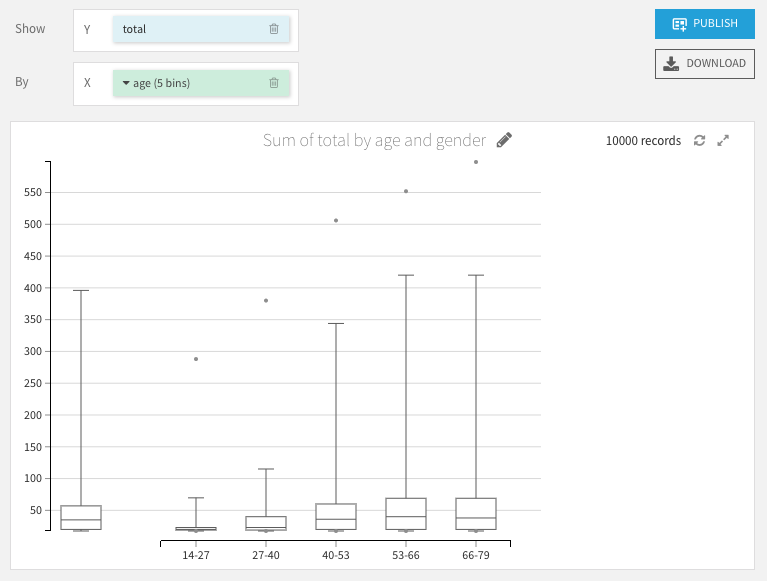
Boxplot
Boxplots build a visualization that shows you the distribution of a required Y axis column, possibly broken down by the bins of an optional X axis column. The Y axis column must be numeric, the X axis column can be numeric or text.
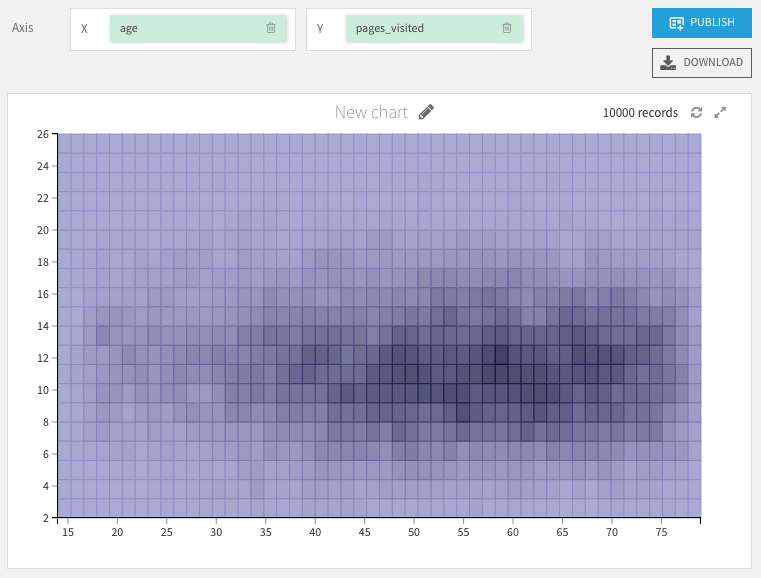
2D Distribution
The 2D Distribution chart builds a visualization that shows you the bivariate distribution of a required X axis column and a required Y axis column. Each column is binned and the resulting cells are colored by the relative density of rows in that cell.
Lift Chart
Warning
This chart type is deprecated. Lift charts are provided for models in Visual ML results.