Input Data Drift
Input Data Drift analyses the distribution of features in the evaluated data. If the distribution of features changes significantly, this likely indicates that the underlying data has significantly changed, which could signal a concept drift.
Having ground truth / labels is not required for Input Data Drift.
The Input Data Drift tab is made of three parts.
Global drift score
Univariate Data Drift
Feature drift importance
Global drift score features the same drift model used to compute the “data drift” metric displayed in the “Evaluations” tab of an Evaluation store. In addition to the accuracy of the drift model are also available:
a lower and upper bound
a binomial test on drift detection
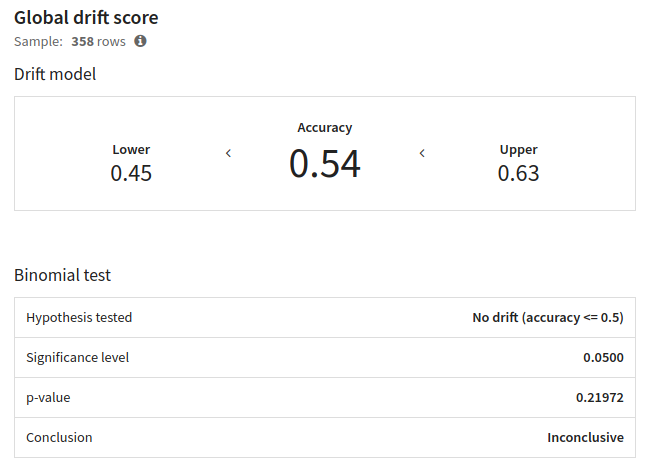
The drift model is trained on the concatenation of the samples of the current ME and the reference. Those samples may be truncated to match the size of the other sample. The drift model predicts whether a line belongs to one or another sample. The higher the accuracy is, the better the drift model can recognize where a line comes from, and so the more the data has drifted.
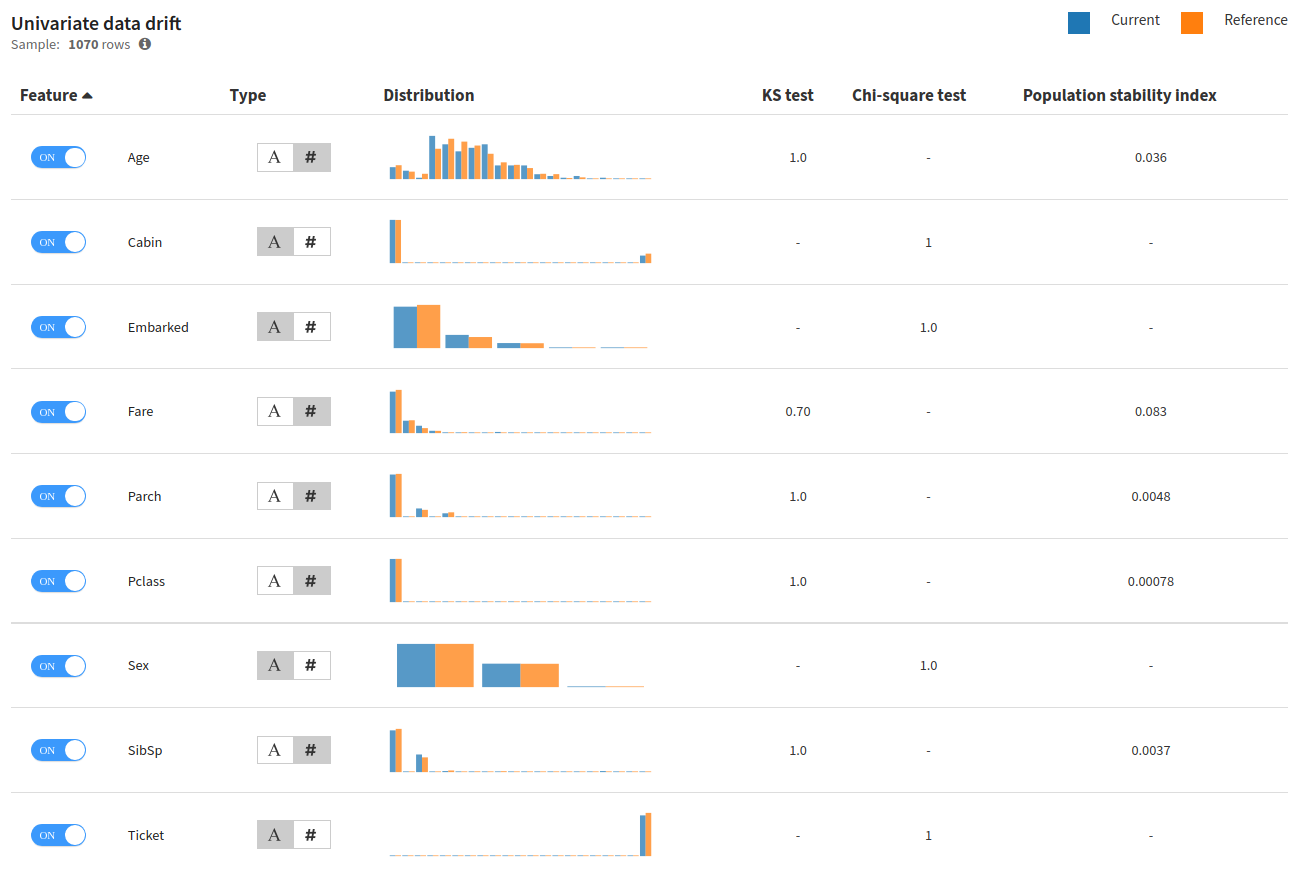
Univariate data drift features per feature drift analysis. It is also in this section that one can configure if a feature should be taken in account by the drift model, and whether it should be handled as numerical or categorical.
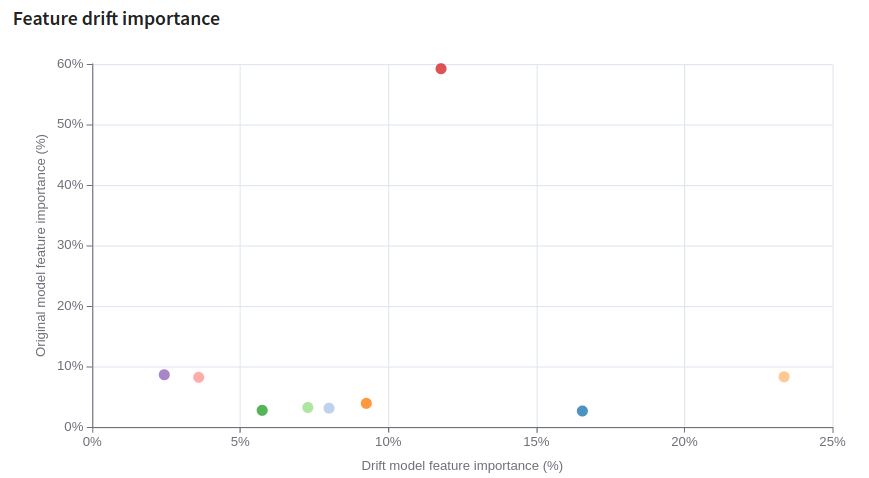
Lastly, the Feature drift importance scatter plot shows feature importance for the original model versus feature importance for the (data classifying) drift model.