Metric
The metric insight allows you to publish a metric about any supported object (dataset, saved model or managed folder).
Publishing a metric insight
You can publish a chart insight from several locations:
From the metrics view
Note
This method is only possible if you have at least the “Read project content” permission.
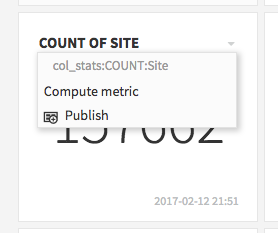
From the metrics view, either in a dataset, saved model or managed folder, you can click on the caret next to each metric, and click Publish
From the dashboard
Click on the + button to add tiles. Select metric, then select the data source for which you want to display a metric. If you only have dashboard access, you will only see the datasets, models and folders that have previously been dashboard-authorized.
Choose the metric to display. You can only add metrics which have already been computed.
Tile display
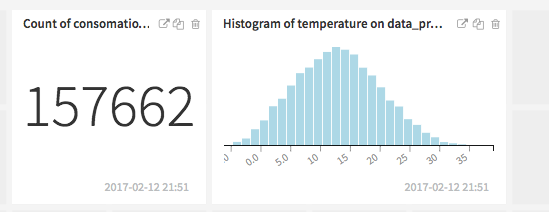
The tile can display either:
The current value of the metric as a large display (either a number, a histogram or a list of values).
The history values
View insight
The full-size view of the insight always displays the history value of the metric.
No edition is possible on the metric insight.